Key Takeaways
-
OriginTrail (TRAC) has surged around 12% in a single day, drawing renewed attention to the token.
-
TRAC has broken out from an ascending triangle near $0.46 on the daily chart, signaling growing bullish momentum.
-
Similar breakout structures in July and October 2025 previously led to strong rallies of 63% and 113%.
-
Holding the $0.44–$0.46 zone as support will be crucial to keep the bullish fractal setup intact.
-
If the pattern plays out, TRAC could attempt a move toward its long-term ascending resistance above $1.00.
OriginTrail, the decentralized knowledge graph protocol, is stepping back into the spotlight as its native token TRAC records a strong 12% daily surge. Beyond the price jump, the real signal is coming from the charts, where a familiar fractal breakout structure is starting to emerge on the daily timeframe, hinting that a larger upside move could be forming.
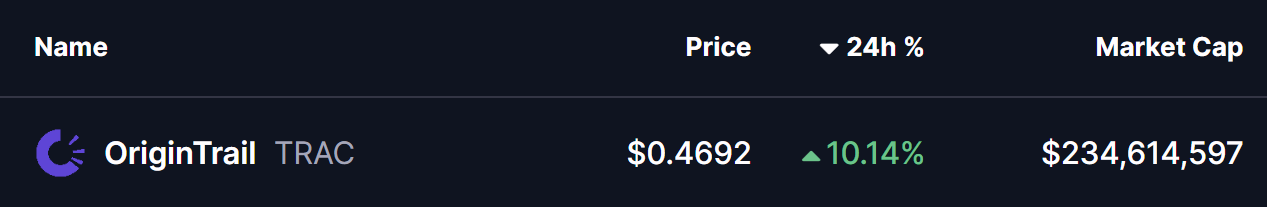
Source: Coinmarketcap
Fractal Breakout Hints at Potential Upside Move
On the daily chart, TRAC has confirmed a breakout from an ascending triangle pattern near the $0.46 level. This breakout is particularly important as price is now trading just above the 200-day moving average, a level that has historically acted as a major trend-defining zone for TRAC.
What makes this setup more compelling is its similarity to previous breakout phases. In late July 2025, a comparable structure resulted in a 63% upside move after price held above its breakout base. Later, in early October 2025, TRAC broke out from a right-angled descending broadening wedge pattern. That move was followed by a reclaim of the 200-day moving average and ultimately led to a powerful 113% rally.
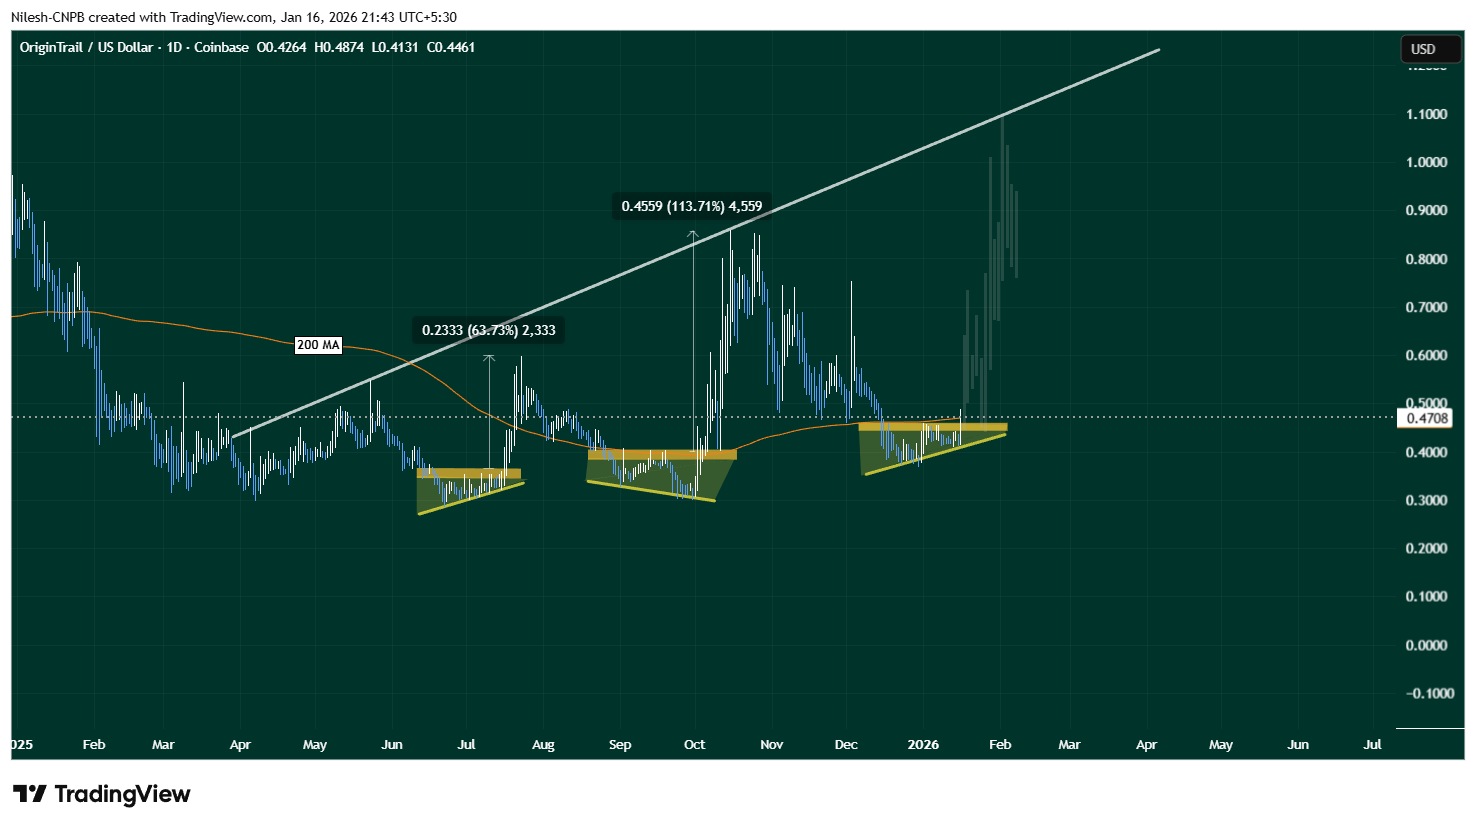
OriginTrail (TRAC) Daily Chart/Coinsprobe (Source: Tradingview)
The current setup shares key characteristics with those earlier moves. Price compression, a clean breakout, and interaction with the 200-day MA suggest that TRAC may once again be transitioning from consolidation into expansion.
What’s Next for TRAC?
If this fractal breakout plays out as expected, holding the $0.44–$0.46 zone as support will be crucial. A sustained hold above this range, along with continued strength above the 200-day moving average, could act as a launchpad for further upside.
In that scenario, TRAC may attempt a move toward its long-term ascending resistance trendline, which currently sits above the $1.00 level. A push toward that zone would align closely with the magnitude of prior fractal-driven rallies seen on the chart.
That said, fractal patterns are never guarantees. Broader market conditions, liquidity, and overall sentiment will continue to influence price action. A failure to hold the $0.44–$0.46 support zone or a rejection back below the 200-day moving average could invalidate the breakout and weaken the bullish fractal thesis.
Bottom Line
TRAC is showing early signs of another technically significant breakout, supported by historical fractal behavior and a reclaim of a key long-term moving average. If buyers can defend the current support zone, the chart suggests that OriginTrail may be positioning itself for a larger upside move in the weeks ahead.
Disclaimer: The views and analysis presented in this article are for informational purposes only and reflect the author’s perspective, not financial advice. Technical patterns and indicators discussed are subject to market volatility and may or may not yield the anticipated results. Investors are advised to exercise caution, conduct independent research, and make decisions aligned with their individual risk tolerance.
About Author: Nilesh Hembade is the Founder and Lead Author of Coinsprobe, with over 5 years of experience in the cryptocurrency and blockchain industry. Since launching Coinsprobe in 2023, he has been providing daily, research-driven insights through in-depth market analysis, on-chain data, and technical research.
Disclaimer: The information on this page may come from third parties and does not represent the views or opinions of Gate. The content displayed on this page is for reference only and does not constitute any financial, investment, or legal advice. Gate does not guarantee the accuracy or completeness of the information and shall not be liable for any losses arising from the use of this information. Virtual asset investments carry high risks and are subject to significant price volatility. You may lose all of your invested principal. Please fully understand the relevant risks and make prudent decisions based on your own financial situation and risk tolerance. For details, please refer to
Disclaimer.
Related Articles
Iran Strikes Saudi Jubail: Tensions in the Strait of Hormuz Trigger a Bitcoin Drop and a Surge in Oil Prices
Iran launched a missile and drone attack on Saudi Arabia’s Jubail on April 7, triggering a large fire and further escalating tensions in the Middle East. Iran rejected the U.S. peace plan and put forward a 10-point counterproposal, indicating that it is seeking to consolidate its advantage in negotiations. The market response was clear, with Bitcoin and precious metals prices fluctuating; the situation ahead will affect global energy and financial markets.
GateNews15m ago
Curve DAO approaches 0.20 USD key support: Can CRV stop the decline and rebound?
The Curve DAO (CRV) price is approaching the $0.20 critical support level, and the short-term trend is facing a choice. Although there are slight signs of stabilization, the overall downward momentum has not been resolved. Technical and fundamental risks are prompting traders to watch whether $0.20 can hold.
GateNews30m ago
Worldcoin is nearing its all-time low: the $326 million buy order failed, and $0.20 is the next target for WLD
Worldcoin (WLD) price continues to hover near its historical lows, currently at $0.2482, and the near-term trend remains weak. Despite large inflows of institutional capital such as Eightco Holdings, there are still no signs of a rebound in the market—if anything, it has intensified supply pressure. On-chain data supports the risk of selling off; once the key support level of $0.2455 is broken, it could quickly drop to $0.20. Overall, WLD faces structural pressure, and the market is focused on whether it can break through the historical low.
GateNews32m ago
Polymarket: Iran ceasefire probability is only 3%, and the surge in oil prices is hitting Bitcoin’s price trend
The expected shift around Iran ceasefire talks is toward pessimism, and the trading market shows that the ceasefire success rate set by Trump is only 3%. Iran rejected a short-term ceasefire proposal and put forward long-term political and economic conditions, further compressing the room for negotiations. Energy markets are strengthening in expectation, and the probability that WTI crude for April, which hit $120, rises to 77%. Crypto assets such as Bitcoin are under pressure during the phase when risk appetite declines, with capital flowing into traditional safe-haven assets.
GateNews38m ago
Grayscale’s New Bets: 43% of Its AI Fund Into One Coin (It’s Not NEAR or RENDER)
Grayscale increased its investment in TAO within its AI-focused crypto fund from 31% to over 43%, highlighting strong confidence in the project amid a selective approach to other AI tokens. This move may influence market sentiment around TAO.
CaptainAltcoin52m ago
Bitcoin Drops Below $69k: Trump’s Final Ultimatum to Iran Triggers Risk-Off Selling
Bitcoin fell to $685,000 on April 7, down about 2% for the day. Driven by concerns over the Middle East situation, risk-off sentiment has increased. With the market under pressure and international oil prices rising, the crypto market has faced headwinds, and investors lack confidence in a Bitcoin rebound. In the short term, macro events will continue to affect Bitcoin’s price action.
GateNews1h ago
