
Hedera (HBAR) starts the week trading quietly, but there is plenty happening under the surface. A scheduled mainnet upgrade later this month keeps the network in focus, while Wyoming’s state-backed stablecoin initiative continues to lean on Hedera for international connectivity.
At the same time, institutional tokenization efforts tied to firms like Archax and BlackRock-linked funds are reinforcing Hedera’s long-term narrative.
Despite those developments, the HBAR price action remains cautious, with traders waiting for confirmation on the chart.
- What the Hedera chart is showing
- What market indicators are saying
- HBAR price short-term outlook for this week
What the Hedera chart is showing
On the 4H chart, HBAR remains locked in a broader downtrend that began after the sharp breakdown earlier in the cycle. That large sell-off marked a structural shift, and price has struggled to reclaim previous support levels since. Over recent weeks, however, downside momentum has slowed noticeably.
The HBAR price is now trading in a tight consolidation zone, holding just above recent lows. Price has started forming a series of higher short-term reactions, but these moves lack follow-through.
This suggests sellers are no longer aggressive, yet buyers have not stepped in with conviction either. The structure currently favors sideways movement unless a clear breakout occurs.
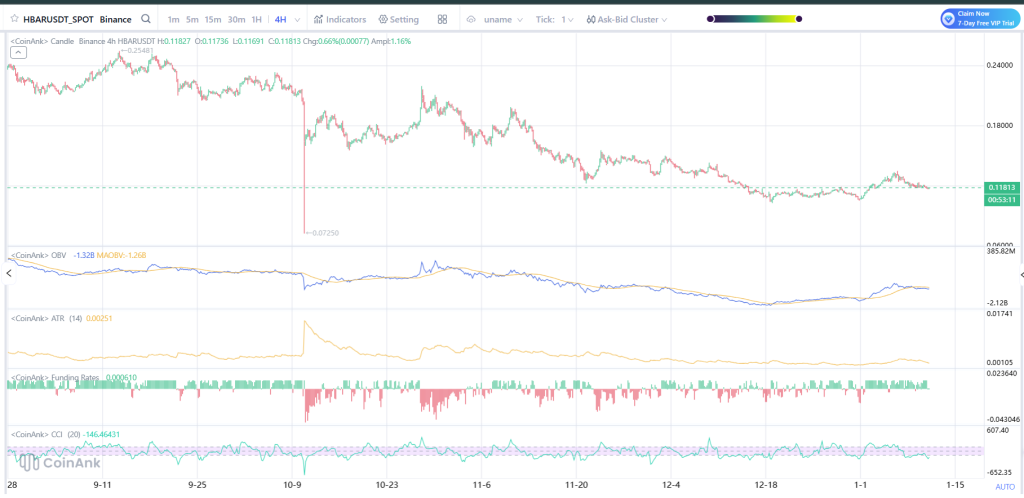
Source: Coinank
What market indicators are saying
OBV is still very negative on balance, and this is a clear indicator that overall participation is not yet back. However, OBV has fallen into a flat pattern and is now stabilizing, which is a sign that a potential turn or a relief rally might soon happen.
ATR continues to trend lower after the earlier volatility spike, signaling compressed price action and reduced expansion. This typically occurs prior to a directional change, but it does not foretell the direction.
Funding rates remain flat and around neutral, implying a balanced use of leverage with no overcrowded positions.
The CCI has recently moved into oversold and has started to reverse and move back, showing waning downside momentum in the short run.
_****Artificial Superintelligence Alliance (FET) Price Returns To The Zone That Sparked Every Major Rally**
HBAR price short-term outlook for this week
With Hedera trading around $0.1178, price is sitting directly in the middle of this range. The first level of support comes in at $0.115. As long as this level continues to support price action, there is no reason to expect any further sideway movements or breaks lower.
A clear break below $0.115 would bring about a test of $0.110 and further down to $0.105. Breaking below $0.100 would be a clear sign that a bearish impulse is underway and that any form of rebound is likely to be delayed.
On the flip side, the first level of resistance is close to $0.122. Crossing above that point would be the first indicator that the market is about to see the revival of buying pressure.
If that resistance is sustained, buy/sell alerts for the HBAR price may reach $0.128, followed by $0.132, which saw previous sell activity. After that, the next level to watch is $0.140, with stronger resistance sitting in the $0.150–$0.155 area.
For this week, HBAR is most likely to trade between $0.115 and $0.130. A move above $0.132 would improve the short-term picture, while a drop below $0.110 would keep the broader correction in place.
Disclaimer: The information on this page may come from third parties and does not represent the views or opinions of Gate. The content displayed on this page is for reference only and does not constitute any financial, investment, or legal advice. Gate does not guarantee the accuracy or completeness of the information and shall not be liable for any losses arising from the use of this information. Virtual asset investments carry high risks and are subject to significant price volatility. You may lose all of your invested principal. Please fully understand the relevant risks and make prudent decisions based on your own financial situation and risk tolerance. For details, please refer to
Disclaimer.
Related Articles
Bitcoin, ether, solana hold steady as Trump sets Tuesday night deadline for Iran deal
Bitcoin dipped to $68,589 after a brief rally fueled by ceasefire news, as geopolitical tensions persist. Other cryptocurrencies also fell. Market uncertainty continues, with Bitcoin trading within the $65,000 to $73,000 range, awaiting Trump's deadline for Iran negotiations.
CoinDesk9m ago
Bitcoin drops toward $68,000 as demand weakens and whales sell
Bitcoin BTC$68,767.57 slid toward $68,000 on Tuesday, with traditional markets closed in Hong Kong for a long weekend, as repeated failures near $70,000 left the bitcoin market vulnerable to a break lower.
The drop came after another failed push above $70,000, with prices slipping quickly once
CoinDesk43m ago
Bitcoin is hovering around the $68,000 threshold, and the risk of further downside is increasing as whales sell and demand remains weak.
Gate News: Bitcoin’s price has fallen to around $68,000. It had repeatedly failed to break through the $70,000 level, and market momentum has clearly weakened. The current price is still within the $65,000 to $73,000 trading range, but the risk of testing the lower end of the range is rising.
GateNews46m ago
Santiment Alert: BTC profit-loss ratio hits 2.95, the top signal is approaching
Based on Santiment data, Bitcoin’s profit-to-loss trade ratio has reached 2.95:1, nearing the historical alert level of 3.0, which may signal a short-term price top. A high profit-to-loss ratio also reflects optimistic market sentiment, but it can also build up selling pressure. Historical cases show that a profit-to-loss ratio near 3.0 does not necessarily lead to a pullback; the market needs to combine multiple indicators for a comprehensive analysis.
MarketWhisper1h ago
Freedom of Money surges 50%, as CZ’s new book drives a wave of same-name meme coin hype
Meme coin Freedom of Money saw a major surge of 50% on April 7, with its market value exceeding $22 million, driven by market sentiment after CZ announced that a new book is set to be released. However, the coin has no official connection to CZ or Binance, and its rally is purely a market-sentiment hype; investors should be cautious of the risks stemming from a lack of fundamental support.
MarketWhisper1h ago
The crypto market is broadly down; only the RWA sector is up slightly, at 0.42%.
On April 7, the crypto market fell broadly, with only the RWA sector up slightly by 0.42%. Major coins Bitcoin and Ethereum declined by 0.34% and 0.43%, respectively. Other sectors generally contracted, but some projects such as Creditcoin and Centrifuge rose against the trend.
GateNews2h ago
