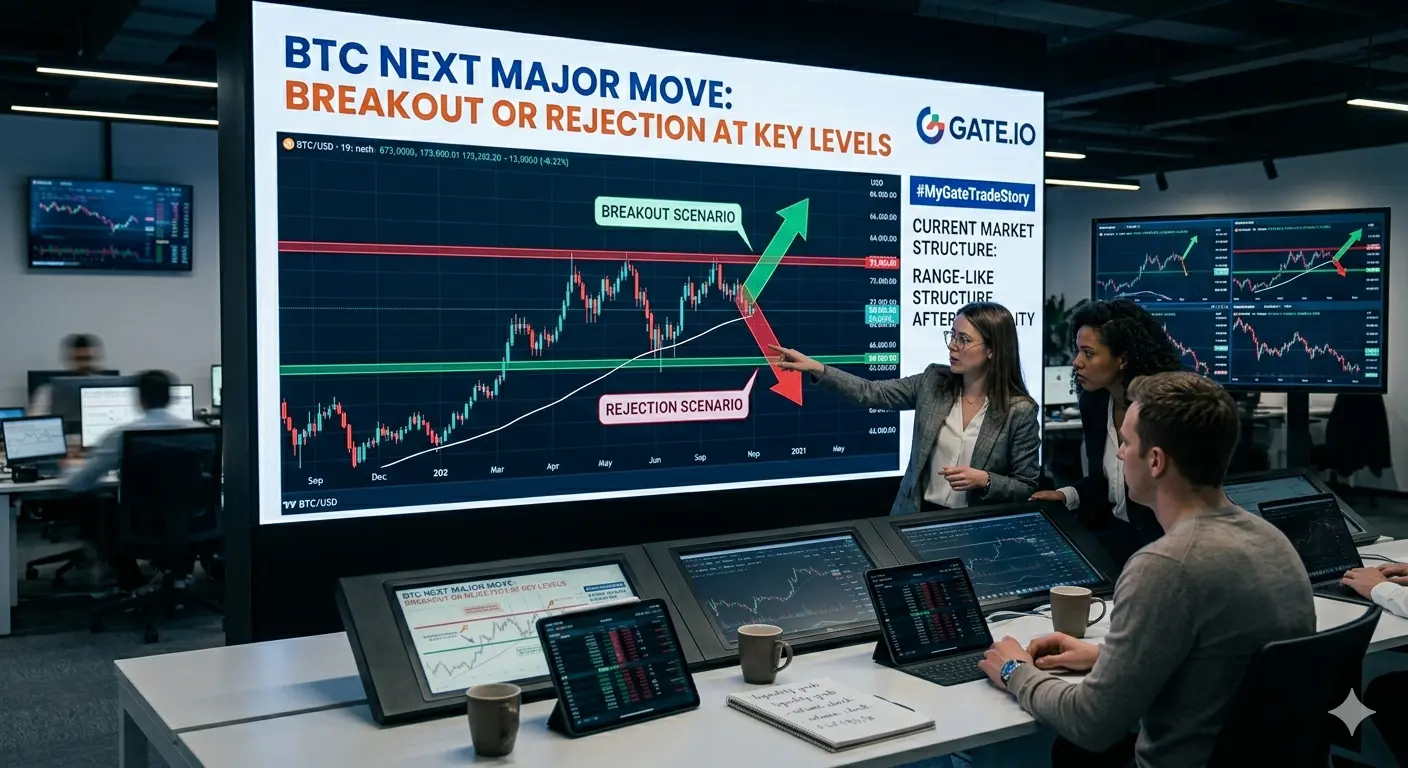
𝐁𝐓𝐂 𝐍𝐞𝐱𝐭 𝐌𝐚𝐣𝐨𝐫 𝐌𝐨𝐯𝐞 𝐏𝐫𝐞𝐝𝐢𝐜𝐭𝐢𝐨𝐧: 𝐁𝐫𝐞𝐚𝐤𝐨𝐮𝐭 𝐨𝐫 𝐑𝐞𝐣𝐞𝐜𝐭𝐢𝐨𝐧 𝐚𝐭 𝐊𝐞𝐲 𝐋𝐞𝐯𝐞𝐥𝐬
#MyGateTradeStory
𝐂𝐮𝐫𝐫𝐞𝐧𝐭 𝐌𝐚𝐫𝐤𝐞𝐭 𝐒𝐭𝐫𝐮𝐜𝐭𝐮𝐫𝐞
Bitcoin is currently trading in a critical phase where the market is trying to decide between continuation of the trend or a deeper correction. Price action has been moving in a range-like structure after strong volatility phases, which shows that the market is building liquidity on both sides. This type of structure usually appears before a major breakout or breakdown, where the next directional move becomes significantly stronger.
𝐊𝐞𝐲 𝐋𝐞𝐯𝐞𝐥𝐬 𝐓𝐡𝐚𝐭 𝐌𝐚𝐭𝐭𝐞𝐫 𝐌𝐨𝐬𝐭
At this stage, the most important factor is not random price movement but key liquidity zones. Bitcoin is respecting major support and resistance areas where buyers and sellers are actively defending positions. The market is currently reacting around a critical mid-range zone, and whichever side wins this battle will likely control the next major trend.
Upper resistance zone = potential breakout trigger
Lower support zone = liquidation + accumulation area
Mid-range = indecision zone where fake moves often occur
This structure suggests that the market is preparing for expansion after compression.
𝐁𝐫𝐞𝐚𝐤𝐨𝐮𝐭 𝐒𝐜𝐞𝐧𝐚𝐫𝐢𝐨
If Bitcoin successfully breaks above the resistance zone with strong volume, the market could enter a bullish expansion phase. A breakout without volume is usually weak, but a breakout with strong participation often leads to fast momentum-driven rallies.
In a bullish breakout scenario:
Short positions may get liquidated
Momentum traders will enter aggressively
Price can move rapidly due to low resistance above
In such conditions, the market often moves in a fast impulse wave, not slow movement, because liquidity gets thin above resistance zones.
𝐑𝐞𝐣𝐞𝐜𝐭𝐢𝐨𝐧 𝐒𝐜𝐞𝐧𝐚𝐫𝐢𝐨
If Bitcoin fails to break resistance and gets rejected, the market can shift into a bearish continuation or deeper retracement phase. Rejection usually happens when buyers fail to sustain momentum and sellers regain control at key levels.
In a rejection scenario:
Long positions may face liquidation pressure
Price can quickly move back into support zones
Market sentiment can turn bearish rapidly
This is often where retail traders get trapped, buying breakouts that fail or chasing momentum too late.
𝐋𝐢𝐪𝐮𝐢𝐝𝐢𝐭𝐲 𝐁𝐞𝐡𝐚𝐯𝐢𝐨𝐫 𝐀𝐧𝐚𝐥𝐲𝐬𝐢𝐬
Modern Bitcoin price movement is heavily driven by liquidity. The market does not move randomly—it moves toward areas where stop losses are concentrated. Equal highs, equal lows, and breakout zones often act as liquidity targets.
Currently, both sides of the market are building liquidity:
Above resistance = trapped short liquidity
Below support = trapped long liquidity
This creates a setup where a strong move can trigger a liquidity sweep followed by trend expansion.
𝐕𝐨𝐥𝐮𝐦𝐞 𝐚𝐧𝐝 𝐌𝐨𝐦𝐞𝐧𝐭𝐮𝐦 𝐅𝐚𝐜𝐭𝐨𝐫
Volume is the confirmation tool for any breakout or rejection. Without volume, price movement is often fake or short-lived. A true trend shift requires participation from both retail and institutional players.
Key observation points:
Rising volume on breakout = strong trend confirmation
Low volume breakout = potential fake move
High rejection volume = strong reversal signal
Momentum is what converts a simple move into a sustained trend.
𝐌𝐚𝐜𝐫𝐨 𝐁𝐚𝐜𝐤𝐠𝐫𝐨𝐮𝐧𝐝 𝐈𝐦𝐩𝐚𝐜𝐭
Beyond technical structure, macro factors like inflation data, interest rates, and ETF flows also influence Bitcoin direction. When liquidity conditions are favorable, breakouts are more likely to sustain. When macro uncertainty is high, markets tend to fake breakouts and reverse quickly.
This is why traders must combine:
Technical structure
Liquidity behavior
Macro environment
Ignoring any one factor increases risk significantly.
𝐈𝐧𝐬𝐭𝐢𝐭𝐮𝐭𝐢𝐨𝐧𝐚𝐥 𝐁𝐞𝐡𝐚𝐯𝐢𝐨𝐫
Large players usually do not chase price. They accumulate during consolidation and distribute during expansion. Current structure suggests that institutions are likely positioning during range formation, waiting for liquidity expansion before committing fully.
This is why range markets often feel “manipulated” to retail traders.
𝐑𝐢𝐬𝐤 𝐌𝐚𝐧𝐚𝐠𝐞𝐦𝐞𝐧𝐭 𝐈𝐦𝐩𝐨𝐫𝐭𝐚𝐧𝐜𝐞
In this type of uncertain structure, risk management becomes more important than prediction. Traders should avoid over-leveraging and instead focus on:
Waiting for confirmation
Avoiding early entries in range
Using strict stop loss levels
Targeting high probability zones only
Survival is more important than catching every move.
𝐅𝐢𝐧𝐚𝐥 𝐏𝐫𝐞𝐝𝐢𝐜𝐭𝐢𝐨𝐧 𝐕𝐢𝐞𝐰
At this moment, Bitcoin is at a decision point. The market is compressing energy and building liquidity for the next major expansion. A breakout above resistance could trigger a strong bullish phase, while rejection could lead to deeper correction and liquidity hunting below support.
The next move will likely be fast and aggressive, meaning traders must be prepared for volatility rather than slow trends.
𝐂𝐨𝐧𝐜𝐥𝐮𝐬𝐢𝐨𝐧
Bitcoin is currently in a critical equilibrium zone between buyers and sellers. The structure suggests that a major move is approaching, but direction will depend on liquidity confirmation, volume strength, and macro support. In such environments, patience and disciplined execution are the only real edge.
#PredictWorldCupWin40000U #PredictWorldCupShare20000U @Gate_Square @GateSquare