


#BTC A quiet purchase of 270,000 BTC has drawn attention! What market breakout is being watched?
A whale purchase exceeding 270,000 BTC, executed at an average price of $59,000, has once again come into focus.
While daily BTC inflows from small investors dropped to as low as 329, overall interest remained below that of previous cycles.
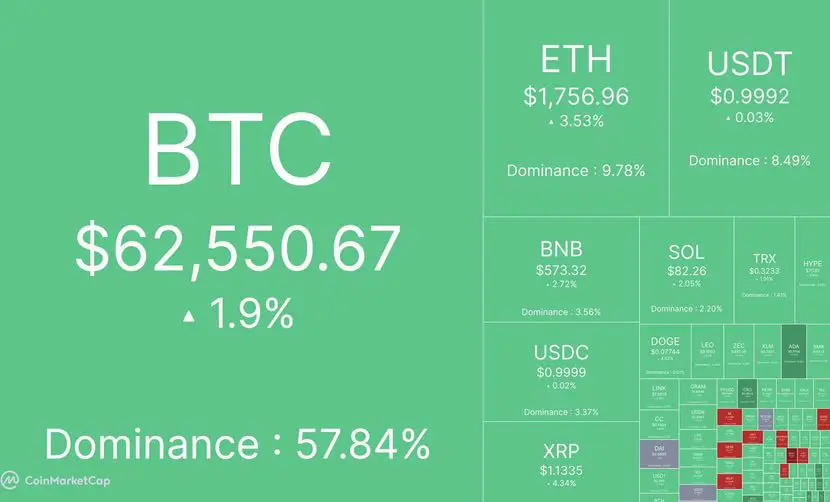
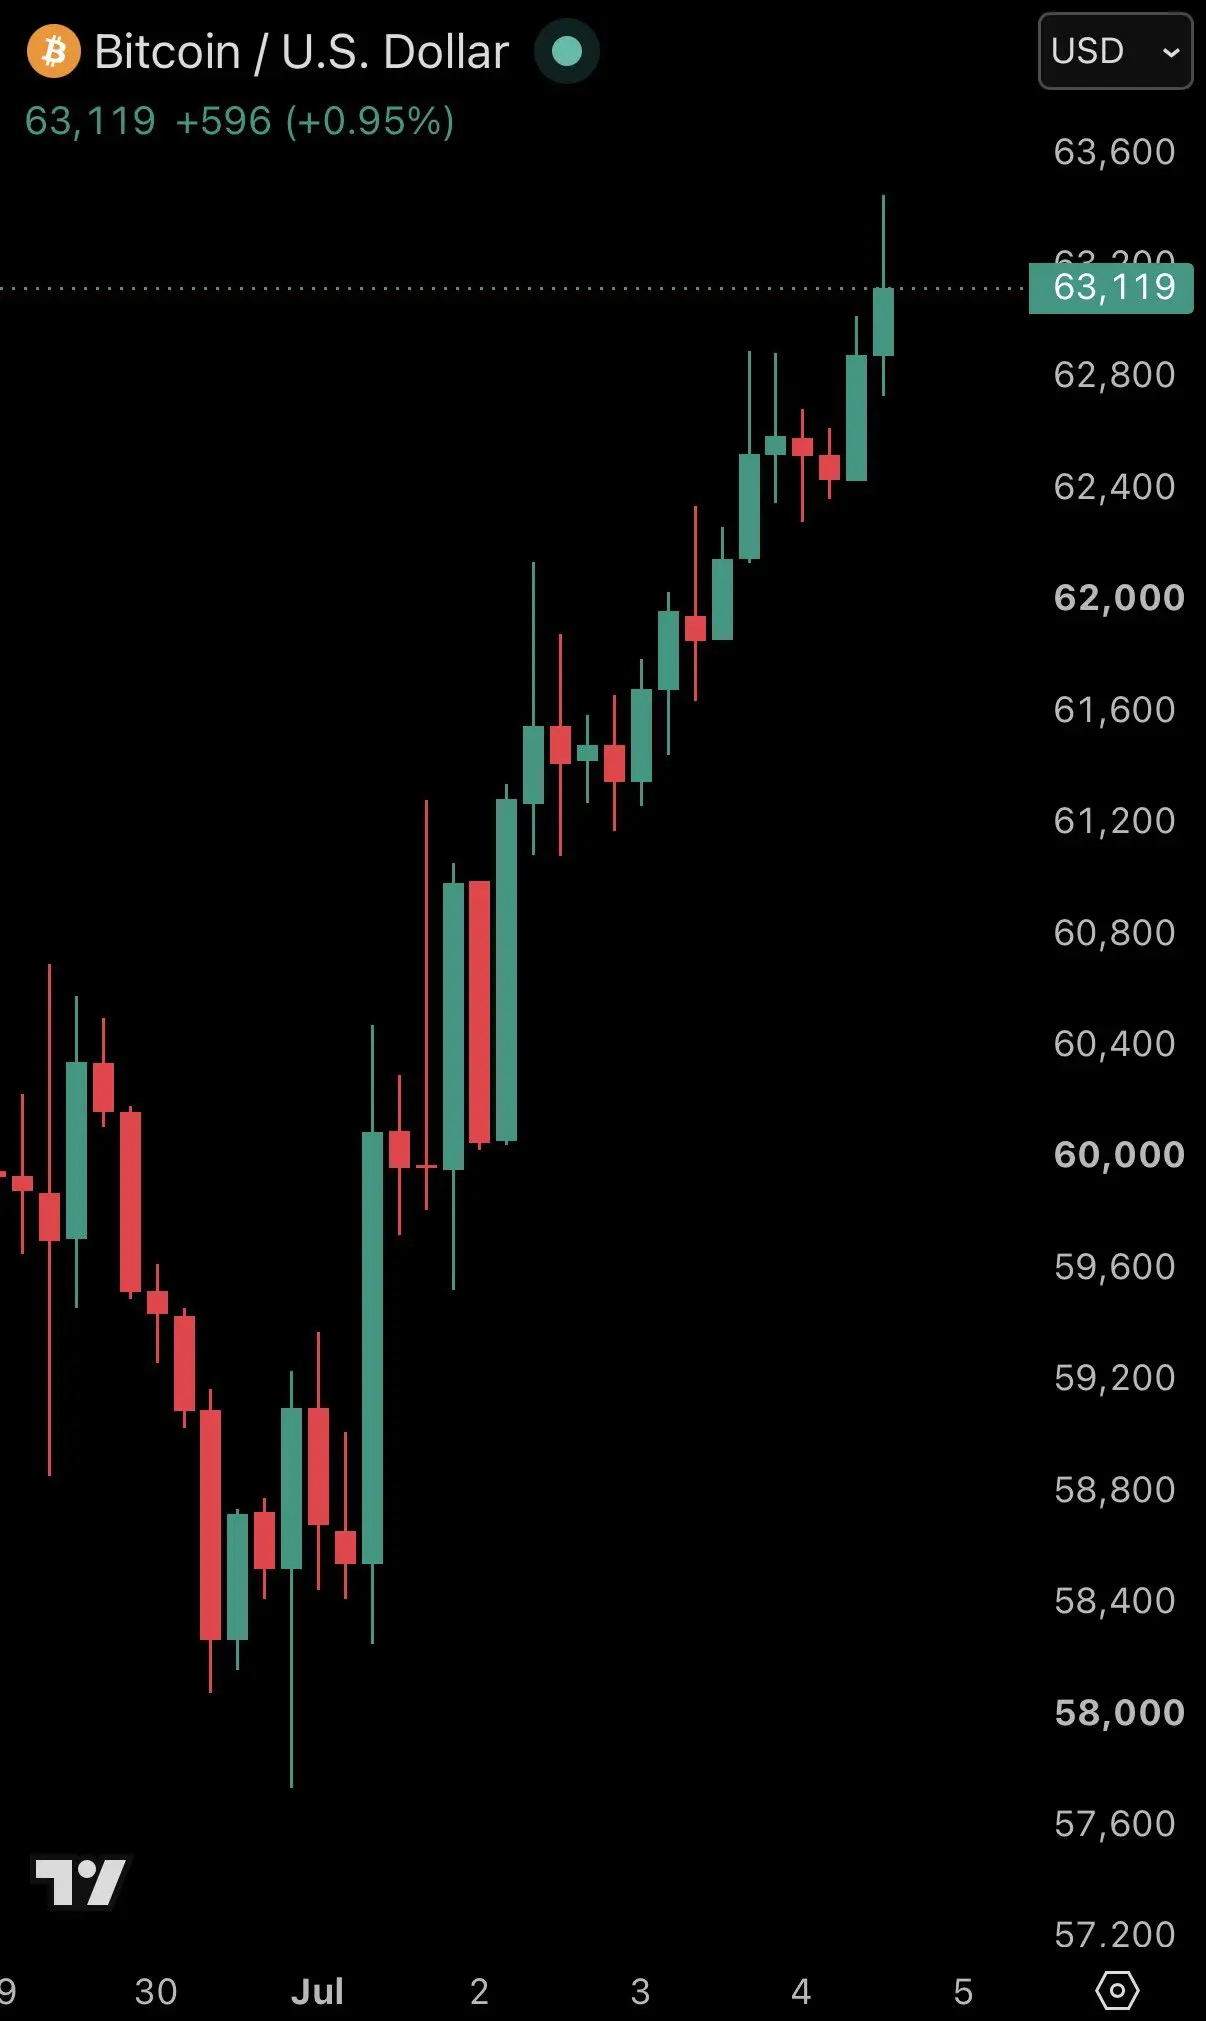
In the current landscape, large wallets have resumed accumulation as $BTC retreated to the $60,000–$62,000 range.
The impact of spot Bitcoin ETF products has been notable amidst the retail activity that weakened after 2021.
On-chain data for Bitcoin revealed two distinct market trends. While large investors turned back to buying following the recent dip, activity among small investors remained well below levels seen in previous bull markets.
Whales have resumed buying; data shows large wallets accumulating over 270,000 Bitcoin at an average price of $59,000. This period is considered one of the strongest accumulation phases of recent times, despite persistent market sell pressure.
Large investors accumulated over 270,000 BTC at an average price of around $59,000, even as sell pressure persisted in the market.
Data comparing the 30-day balance changes in whale wallets against the Bitcoin price indicates that large investors carried out significant sales during the latter part of 2025. Balances in these wallets steadily declined between July and November, even though Bitcoin remained above $100,000.
The period of strongest buying occurred between late December 2025 and early January 2026. This period stood out as the time when the heaviest whale buying activity on the chart was recorded. While the pace of accumulation slowed in February and March, large investors maintained their existing positions.
Signs of renewed accumulation in the $60,000 range
Whale balances remained stable throughout April and May. However, recent data indicates that large players have begun increasing their holdings again as the Bitcoin price retreated to the $60,000–$62,000 range. This trend suggests that interest from institutional or high-capital investors persists despite the price weakness.
Retail investor interest remains weak
While large investors have become more visible, the same level of activity has not been observed among retail investors. Data indicates that the daily inflow from wallets holding less than 1 BTC stands at only 329 BTC.
This figure reveals a stark contrast when compared to previous cycles. In 2021, daily inflows reached approximately 4,900 BTC, with a monthly total of 2,690 BTC. In 2018, the flow from retail investors was even higher, recording levels of 3,700 BTC monthly and 10,400 BTC daily.
The volume of BTC held by retail investors remains historically low compared to previous bull market periods.
The ETF effect and shifting investment preferences
Data shows that retail investor activity dropped sharply following the 2021 peak and has not returned to previous levels during the current cycle, even as Bitcoin surpassed the $100,000 mark. Spot Bitcoin ETFs are considered a key factor in this shift, as these instruments allow investors to gain exposure to Bitcoin without transferring crypto assets to exchanges.
Additionally, it appears that some investors are turning to alternative crypto assets, while others prefer to hold their Bitcoin positions for longer periods. Consequently, while retail investor activity on exchanges remains limited, on-chain data reveals a trend of large wallets resuming accumulation.
$BTC
A whale purchase exceeding 270,000 BTC, executed at an average price of $59,000, has once again come into focus.
While daily BTC inflows from small investors dropped to as low as 329, overall interest remained below that of previous cycles.
In the current landscape, large wallets have resumed accumulation as $BTC retreated to the $60,000–$62,000 range.
The impact of spot Bitcoin ETF products has been notable amidst the retail activity that weakened after 2021.
On-chain data for Bitcoin revealed two distinct market trends. While large investors turned back to buying following the recent dip, activity among small investors remained well below levels seen in previous bull markets.
Whales have resumed buying; data shows large wallets accumulating over 270,000 Bitcoin at an average price of $59,000. This period is considered one of the strongest accumulation phases of recent times, despite persistent market sell pressure.
Large investors accumulated over 270,000 BTC at an average price of around $59,000, even as sell pressure persisted in the market.
Data comparing the 30-day balance changes in whale wallets against the Bitcoin price indicates that large investors carried out significant sales during the latter part of 2025. Balances in these wallets steadily declined between July and November, even though Bitcoin remained above $100,000.
The period of strongest buying occurred between late December 2025 and early January 2026. This period stood out as the time when the heaviest whale buying activity on the chart was recorded. While the pace of accumulation slowed in February and March, large investors maintained their existing positions.
Signs of renewed accumulation in the $60,000 range
Whale balances remained stable throughout April and May. However, recent data indicates that large players have begun increasing their holdings again as the Bitcoin price retreated to the $60,000–$62,000 range. This trend suggests that interest from institutional or high-capital investors persists despite the price weakness.
Retail investor interest remains weak
While large investors have become more visible, the same level of activity has not been observed among retail investors. Data indicates that the daily inflow from wallets holding less than 1 BTC stands at only 329 BTC.
This figure reveals a stark contrast when compared to previous cycles. In 2021, daily inflows reached approximately 4,900 BTC, with a monthly total of 2,690 BTC. In 2018, the flow from retail investors was even higher, recording levels of 3,700 BTC monthly and 10,400 BTC daily.
The volume of BTC held by retail investors remains historically low compared to previous bull market periods.
The ETF effect and shifting investment preferences
Data shows that retail investor activity dropped sharply following the 2021 peak and has not returned to previous levels during the current cycle, even as Bitcoin surpassed the $100,000 mark. Spot Bitcoin ETFs are considered a key factor in this shift, as these instruments allow investors to gain exposure to Bitcoin without transferring crypto assets to exchanges.
Additionally, it appears that some investors are turning to alternative crypto assets, while others prefer to hold their Bitcoin positions for longer periods. Consequently, while retail investor activity on exchanges remains limited, on-chain data reveals a trend of large wallets resuming accumulation.
$BTC