Key Takeaways
-
OriginTrail (TRAC) has surged around 12% in a single day, drawing renewed attention to the token.
-
TRAC has broken out from an ascending triangle near $0.46 on the daily chart, signaling growing bullish momentum.
-
Similar breakout structures in July and October 2025 previously led to strong rallies of 63% and 113%.
-
Holding the $0.44–$0.46 zone as support will be crucial to keep the bullish fractal setup intact.
-
If the pattern plays out, TRAC could attempt a move toward its long-term ascending resistance above $1.00.
OriginTrail, the decentralized knowledge graph protocol, is stepping back into the spotlight as its native token TRAC records a strong 12% daily surge. Beyond the price jump, the real signal is coming from the charts, where a familiar fractal breakout structure is starting to emerge on the daily timeframe, hinting that a larger upside move could be forming.
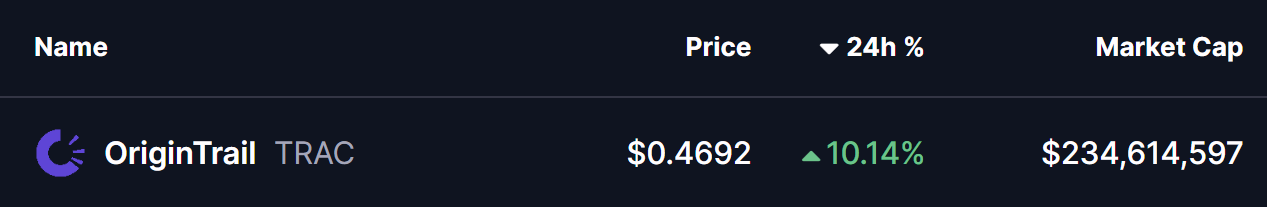
Source: Coinmarketcap
Fractal Breakout Hints at Potential Upside Move
On the daily chart, TRAC has confirmed a breakout from an ascending triangle pattern near the $0.46 level. This breakout is particularly important as price is now trading just above the 200-day moving average, a level that has historically acted as a major trend-defining zone for TRAC.
What makes this setup more compelling is its similarity to previous breakout phases. In late July 2025, a comparable structure resulted in a 63% upside move after price held above its breakout base. Later, in early October 2025, TRAC broke out from a right-angled descending broadening wedge pattern. That move was followed by a reclaim of the 200-day moving average and ultimately led to a powerful 113% rally.

OriginTrail (TRAC) Daily Chart/Coinsprobe (Source: Tradingview)
The current setup shares key characteristics with those earlier moves. Price compression, a clean breakout, and interaction with the 200-day MA suggest that TRAC may once again be transitioning from consolidation into expansion.
What’s Next for TRAC?
If this fractal breakout plays out as expected, holding the $0.44–$0.46 zone as support will be crucial. A sustained hold above this range, along with continued strength above the 200-day moving average, could act as a launchpad for further upside.
In that scenario, TRAC may attempt a move toward its long-term ascending resistance trendline, which currently sits above the $1.00 level. A push toward that zone would align closely with the magnitude of prior fractal-driven rallies seen on the chart.
That said, fractal patterns are never guarantees. Broader market conditions, liquidity, and overall sentiment will continue to influence price action. A failure to hold the $0.44–$0.46 support zone or a rejection back below the 200-day moving average could invalidate the breakout and weaken the bullish fractal thesis.
Bottom Line
TRAC is showing early signs of another technically significant breakout, supported by historical fractal behavior and a reclaim of a key long-term moving average. If buyers can defend the current support zone, the chart suggests that OriginTrail may be positioning itself for a larger upside move in the weeks ahead.
Disclaimer: The views and analysis presented in this article are for informational purposes only and reflect the author’s perspective, not financial advice. Technical patterns and indicators discussed are subject to market volatility and may or may not yield the anticipated results. Investors are advised to exercise caution, conduct independent research, and make decisions aligned with their individual risk tolerance.
About Author: Nilesh Hembade is the Founder and Lead Author of Coinsprobe, with over 5 years of experience in the cryptocurrency and blockchain industry. Since launching Coinsprobe in 2023, he has been providing daily, research-driven insights through in-depth market analysis, on-chain data, and technical research.
Disclaimer: The information on this page may come from third parties and does not represent the views or opinions of Gate. The content displayed on this page is for reference only and does not constitute any financial, investment, or legal advice. Gate does not guarantee the accuracy or completeness of the information and shall not be liable for any losses arising from the use of this information. Virtual asset investments carry high risks and are subject to significant price volatility. You may lose all of your invested principal. Please fully understand the relevant risks and make prudent decisions based on your own financial situation and risk tolerance. For details, please refer to
Disclaimer.
Related Articles
BTC 15-minute surge of 0.84%: Upward momentum driven by insufficient liquidity and the resonance between futures premium arbitrage
2026-04-05 15:15 to 15:30 (UTC), the BTC price fluctuated within the 66,938.9 to 67,529.9 USDT range, with a 15-minute return of +0.84% and a volatility (amplitude) of 0.88%. During the same period, market trading activity increased: the number of active on-chain addresses over 10 minutes reached 420,690, short-term buying sentiment improved, and attention to the market was boosted.
The main drivers behind this move are persistent liquidity tightness in the spot and derivatives markets. Current trading volume is significantly lower than the range since the end of 2023, and the threshold for buy-side pressure to push prices higher has dropped markedly.
GateNews1h ago
Hyperliquid Price Gains as Futures Activity Lifts Momentum
Key insights
Hyperliquid open interest climbed above one point six billion dollars, signaling stronger derivatives participation and reinforcing current price momentum across markets.
Commodity perpetuals and event contracts increased trading activity, pushing daily volumes past two point fo
CryptoNewsLand1h ago
Saylor responds to Schiff: Bitcoin has been the best performer since August 2020—time horizon matters
Peter Schiff said that Bitcoin has risen only 12% over the past five years and has underperformed the Nasdaq, the S&P 500, gold, and silver; Michael Saylor then responded that Bitcoin has been the best mainstream asset since August 2020, emphasizing the importance of the time frame.
GateNews2h ago
Robert Kiyosaki recommends Bitcoin, gold as 1974 shift comes full circle
Rich Dad Poor Dad author Robert Kiyosaki has argued that the economic shifts set in motion more than five decades ago are now unfolding, advocating for Bitcoin and gold while warning against rising debt, inflation and retirement risks.
In a Saturday post on X, Kiyosaki pointed to 1974 as a
Cointelegraph3h ago
DOGE Defends Key Support While On-Chain Activity Increases
DOGE active addresses jumped 28% in one week, showing growing network engagement.
Price holds critical levels near $0.0912–$0.0928 despite minor dips.
Breaking above $0.0930 could target $0.0950, $0.0980, and potentially $0.10.
Dogecoin — DOGE, has shown interesting movements this week,
CryptoNewsLand4h ago
Is Bitcoin mispricing a prolonged Iran war? Ex-hedge fund manager weighs in
James Lavish warns Bitcoin holders that continued conflict in Iran could trigger inflation and market downturns. While Bitcoin may face further declines, he sees potential long-term opportunities. He discusses the impact of global economic pressures on investments.
Cointelegraph5h ago
