Yusfirah

vip
Age 1.5 Year
Peak Tier 5
No content yet
Pin
🎁 100% chance to win! Gate Square Issue 2️⃣0️⃣ Community Growth Points Lottery Carnival begins!
Zero threshold, no trading required, complete interactions to get lottery eligibility!
💰 Bonus boost: Up to $10,000 CFD trial voucher, can trade popular stocks!
Also prediction market trial vouchers, fee rebate vouchers, and other card voucher gift packs await your draw!
Every 300 points, draw directly 👇
https://www.gate.com/activities/pointprize?now_period=20
🌟 How to participate:
1️⃣ Post, comment, like, chat, easily earn growth points
2️⃣ Click the post button [+] to enter [Activity Center]
BTC1.10%
ETH1.74%
SPCX1.61%
post-image
  • Reward
  • 12
  • Repost
  • Share
ShainingMoon:
To The Moon 🌕
View More
evening market ubdate
gate liveLIVE
318
  • Reward
  • Comment
  • Repost
  • Share
⚽ The World Cup kicks off in the early hours, don't want to stay up and watch the market?
Gate Prediction Market supports following expert trading dynamics, letting the market find opportunities for you:
🔹 Automatically track changes in strategies of Top users on the highest profit ranking, trading volume ranking, and profit ranking
🔹 Supports 24/7 monitoring of key trading activities, so even early morning matches won't miss any trading opportunity
🔹 Follow expert strategies with one click, making World Cup predictions easier
🎁 Join the Gate Green Pitch Prophet World Cup Carnival and shar
GateSquare
⚽ The World Cup kicks off in the early hours, don't want to stay up and watch the market?
Gate Prediction Market supports following expert trading dynamics, letting the market find opportunities for you:
🔹 Automatically track changes in strategies of Top users on the highest profit ranking, trading volume ranking, and profit ranking
🔹 Supports 24/7 monitoring of key trading activities, so even early morning matches won't miss any trading opportunity
🔹 Follow expert strategies with one click, making World Cup predictions easier
🎁 Join the Gate Green Pitch Prophet World Cup Carnival and share the luxurious prize pool of 500,000+ USDT
Join now: https://www.gate.com/competition/football-2026
repost-content-media
  • Reward
  • 6
  • Repost
  • Share
Falcon_Official:
2026 GOGOGO 👊
View More
Red rain of red envelopes is falling in the square, heard you haven’t claimed yet? 👀
Post now and take action – 100% winning rate, the more you post, the more you get!
🎁 Highlights:
✅ Newcomer Gift: First post guarantees a 100% red envelope!
✅ Post Rewards: Covers ETH, GT, Meme coins, position experience coupons – post more, earn more!
✅ Leaderboard Challenge: Win World Cup limited boxes, WCTC limited T-shirts, and up to $1,000U!
Go post your first one now 👉 https://www.gate.com/post
🗓 Event runs until June 30th – join early for a better ranking on the leaderboard!
Details: https://www.gat
ETH1.74%
BTC1.10%
GT1.54%
MEME-1.35%
GateSquare
Red rain of red envelopes is falling in the square, heard you haven’t claimed yet? 👀
Post now and take action – 100% winning rate, the more you post, the more you get!
🎁 Highlights:
✅ Newcomer Gift: First post guarantees a 100% red envelope!
✅ Post Rewards: Covers ETH, GT, Meme coins, position experience coupons – post more, earn more!
✅ Leaderboard Challenge: Win World Cup limited boxes, WCTC limited T-shirts, and up to $1,000U!
Go post your first one now 👉 https://www.gate.com/post
🗓 Event runs until June 30th – join early for a better ranking on the leaderboard!
Details: https://www.gate.com/announcements/article/100168
#BTC #ETH #GT
repost-content-media
  • Reward
  • 11
  • 1
  • Share
Falcon_Official:
2026 GOGOGO 👊
View More
#STRCHitsAllTimeLow
STRC Hits All-Time Low: What the Sharp Decline Means for Investors and the Broader Crypto Market
Introduction
STRC has fallen to a new all-time low, marking another difficult chapter for the token and raising fresh concerns among investors about its long-term outlook. New price lows often trigger fear across the market, but they can also attract value hunters who believe the asset has become oversold. Whether this decline represents a buying opportunity or a warning sign depends on the project's fundamentals, market sentiment, liquidity, and future development plans.
The c
TOKEN1.77%
BTC1.10%
ETH1.74%
Vortex_King
#STRCHitsAllTimeLow
STRC Hits All-Time Low: What the Sharp Decline Means for Investors and the Broader Crypto Market
Introduction
STRC has fallen to a new all-time low, marking another difficult chapter for the token and raising fresh concerns among investors about its long-term outlook. New price lows often trigger fear across the market, but they can also attract value hunters who believe the asset has become oversold. Whether this decline represents a buying opportunity or a warning sign depends on the project's fundamentals, market sentiment, liquidity, and future development plans.
The crypto market has experienced repeated boom-and-bust cycles, and history shows that reaching an all-time low does not automatically determine a project's future. Some digital assets have recovered strongly after prolonged declines, while others have continued losing value until they faded from the market. Understanding why STRC has reached this point is therefore more important than focusing solely on the price itself.
---
Understanding an All-Time Low
An all-time low (ATL) refers to the lowest price an asset has traded since it became publicly available. Breaking below previous support levels often signals intense selling pressure and weak investor confidence.
New all-time lows are typically accompanied by:
- Increased market volatility
- Higher trading volume
- Panic selling
- Reduced investor confidence
- Greater uncertainty about future price direction
However, experienced traders know that major turning points can also emerge during periods of extreme pessimism.
---
Why STRC May Be Falling
Several factors can contribute to a sharp decline in a cryptocurrency.
Weak Market Sentiment
When the broader crypto market experiences risk-off conditions, smaller-cap tokens often fall more aggressively than Bitcoin or Ethereum. Investors usually move toward larger, more established assets during uncertain periods.
Profit-Taking and Liquidity Issues
Low liquidity can amplify price swings. Large sell orders may push prices down rapidly when there are not enough buyers to absorb the selling pressure.
Project-Specific Concerns
Price declines may also reflect concerns about development progress, adoption, partnerships, token utility, or community engagement. If investors lose confidence in the project's roadmap, sustained selling pressure can emerge.
Macroeconomic Conditions
Interest rate expectations, inflation data, regulatory developments, and global financial uncertainty continue to influence digital asset markets. Negative macroeconomic news often reduces demand for higher-risk investments.
---
Market Psychology During Major Declines
One of the biggest drivers of price action is investor psychology.
Fear often spreads quickly after an asset reaches new lows. Social media discussions become increasingly negative, and many investors choose to exit positions to avoid further losses.
At the same time, contrarian investors may begin accumulating if they believe the market has overreacted.
This conflict between fear and opportunity frequently creates high volatility around major support zones.
---
Technical Perspective
From a technical analysis standpoint, breaking into new all-time-low territory removes historical support levels. Traders therefore rely on alternative indicators such as:
- Trading volume
- Relative Strength Index (RSI)
- Moving averages
- Momentum indicators
- Market structure
- On-chain activity
Strong buying volume following an ATL can sometimes signal early accumulation, while continued heavy selling may indicate that the downtrend remains intact.
---
Risk Management Matters
For investors, periods of extreme volatility require disciplined risk management.
Important considerations include:
- Avoid making emotional decisions.
- Use appropriate position sizing.
- Diversify investments.
- Set clear stop-loss levels if trading.
- Focus on long-term fundamentals rather than short-term price movements.
No investment should be based solely on the hope of a recovery.
---
What Could Trigger a Recovery?
Several developments could improve market sentiment toward STRC:
- Positive project updates
- New partnerships
- Increased user adoption
- Improved token utility
- Exchange listings
- Stronger overall crypto market conditions
- Increased developer activity
Recovery generally requires renewed confidence supported by measurable progress rather than speculation alone.
---
The Bigger Picture
Crypto markets have repeatedly demonstrated that prices move in cycles. While some projects never recover from deep declines, others use challenging periods to rebuild, strengthen their ecosystems, and regain investor trust.
For STRC, the coming months will likely depend on the project's execution, transparency, community support, and its ability to deliver meaningful value.
---
Conclusion
STRC reaching an all-time low is a significant event that reflects current market pressures and investor sentiment. While the decline highlights the risks associated with cryptocurrency investing, it does not necessarily determine the project's long-term future. Investors should carefully evaluate the project's fundamentals, monitor upcoming developments, and maintain disciplined risk management before making investment decisions.
As always in the crypto market, volatility creates both risks and opportunities. Success depends not on reacting emotionally to price movements, but on making informed decisions based on research, strategy, and a clear understanding of the market.
repost-content-media
  • Reward
  • 13
  • 2
  • Share
Falcon_Official:
To The Moon 🌕
View More
#PredictionMarketsHitRecordVolume
Prediction markets are experiencing one of the most significant expansion phases in their history, with trading volume reaching unprecedented levels in 2026. This milestone reflects far more than growing interest in blockchain technology—it signals a broader transformation in how individuals and institutions evaluate uncertainty, forecast future events, and make data-driven decisions. As global markets become increasingly interconnected and information travels faster than ever before, prediction markets have emerged as a unique ecosystem where collective inte
post-image
  • Reward
  • 8
  • Repost
  • Share
Falcon_Official:
2026 GOGOGO 👊
View More
#STRCHitsAllTimeLow
The cryptocurrency market has always been defined by innovation, opportunity, and volatility. While many digital assets have delivered extraordinary long-term growth, they have also experienced periods of severe corrections that test the confidence and patience of investors. Today, STRC has reached a new all-time low, becoming one of the most discussed topics across the crypto community. This development has sparked renewed debate about whether the token is approaching a long-term accumulation zone or whether additional downside risks remain.
An all-time low is more than j
post-image
post-image
  • Reward
  • 7
  • 1
  • Share
Falcon_Official:
2026 GOGOGO 👊
View More
EagleEye
#STRCHitsAllTimeLow
📉 Strategy's Latest Decline Highlights the Risks of Leveraged Bitcoin Exposure

Strategy's recent market performance has reignited one of the biggest debates in the crypto investment world: How sustainable is a corporate strategy built around continuously acquiring Bitcoin through capital markets? As Bitcoin slipped below the $60,000 level, the pressure on the company's balance sheet became impossible for investors to ignore.

The latest numbers paint a challenging picture. Strategy's preferred stock STRC fell to a record low of $74, trading at a significant discount to its $100 par value, while MSTR dropped below $90 for the first time in sixteen months. At the same time, the decline in Bitcoin pushed the company's holdings to roughly $10.6 billion in unrealized losses, raising fresh concerns about financial flexibility and future funding capacity.

Much of Strategy's success over recent years has been driven by a straightforward but highly aggressive model: raise capital, purchase more Bitcoin, and rely on long-term appreciation to strengthen shareholder value. During bull markets, that strategy generated remarkable returns and transformed the company into one of the largest institutional holders of Bitcoin. However, every leveraged strategy faces its toughest test when market conditions reverse.
Investor attention is now shifting beyond Bitcoin's price and toward the sustainability of the company's financing model. Reports suggesting that existing cash reserves cover only around **14 months of preferred dividend obligations** have intensified questions about future liquidity if Bitcoin remains under pressure for an extended period. While unrealized losses don't immediately affect operations, prolonged weakness can make raising fresh capital more difficult and expensive.
This situation also highlights the close relationship between traditional finance and digital assets. Strategy is no longer viewed simply as a software company—it has effectively become a leveraged proxy for Bitcoin. As a result, movements in the cryptocurrency market increasingly dictate the company's valuation, shareholder sentiment, and access to financing. Investors buying the stock today are, in many ways, making a direct bet on Bitcoin's long-term trajectory.
Despite current concerns, it's important to remember that Bitcoin has experienced multiple deep corrections throughout its history before recovering during later market cycles. If Bitcoin regains strength, Strategy's balance sheet could improve just as rapidly as it has weakened. On the other hand, an extended period of lower prices would continue testing both investor confidence and the company's ability to maintain its acquisition strategy.
For the broader market, this serves as a reminder that leverage amplifies both opportunity and risk. Strong bull markets often make aggressive strategies appear unstoppable, but market downturns expose the importance of liquidity, capital management, and financial resilience. Companies with concentrated exposure to a single volatile asset naturally experience larger swings in both valuation and investor sentiment.
My Perspective:
Strategy remains one of the boldest corporate experiments in Bitcoin adoption, but bold strategies always come with meaningful risks. In my view, the current situation isn't just a story about one company—it's a case study in how leverage, market psychology, and macroeconomic conditions interact during periods of heightened volatility. Whether Strategy ultimately proves its model successful will depend not only on its financial discipline but also on Bitcoin's ability to recover over the long run. ₿📊
repost-content-media
  • Reward
  • 7
  • Repost
  • Share
Falcon_Official:
2026 GOGOGO 👊
View More
#USNetCapitalInflowsHitRecord884B
The latest U.S. capital flow data has sent a powerful signal to global financial markets. Net capital inflows have climbed to a record $884 billion, highlighting the continued confidence of international investors in U.S. financial assets despite an environment of elevated interest rates, persistent inflation concerns, and ongoing geopolitical uncertainty. This milestone reflects more than a single economic statistic—it demonstrates where global capital is seeking stability, liquidity, and long-term growth opportunities in today's rapidly evolving financial l
post-image
  • Reward
  • 8
  • Repost
  • Share
Falcon_Official:
To The Moon 🌕
View More
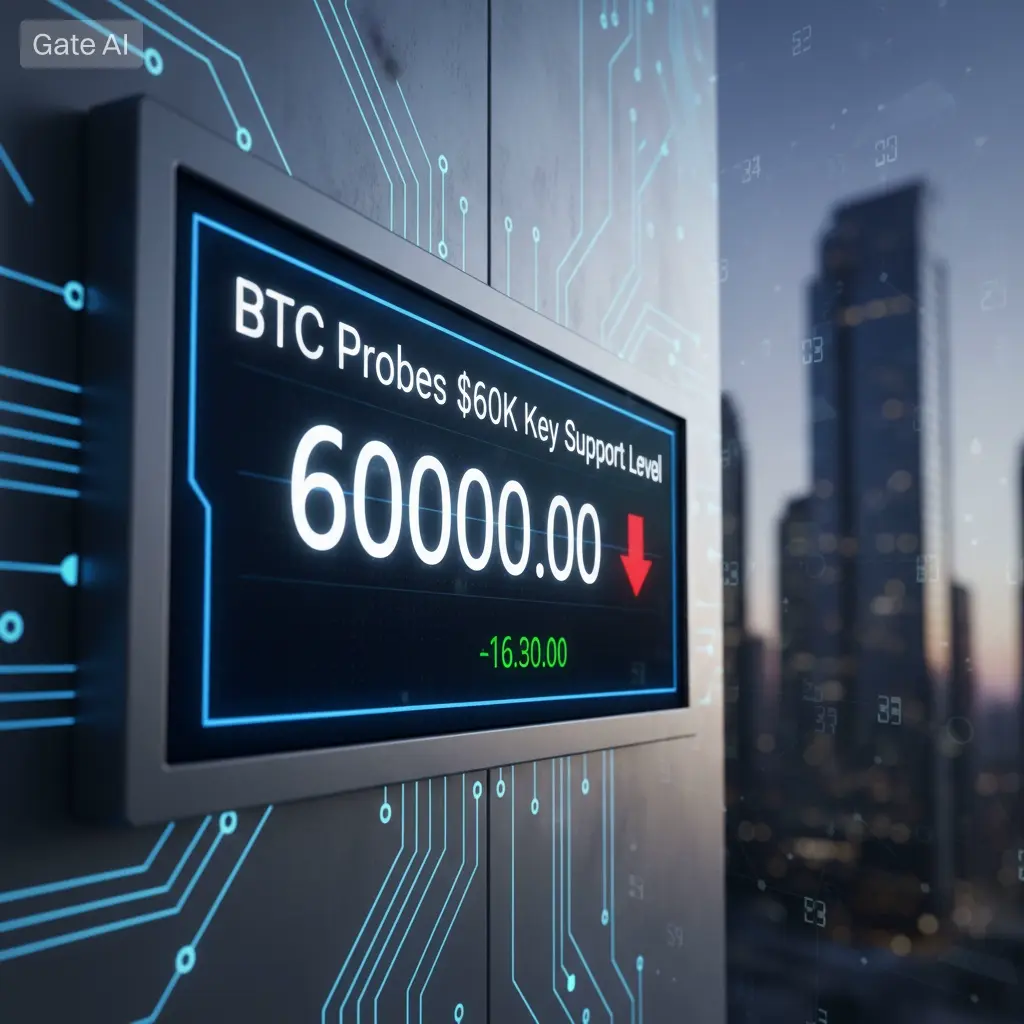
#BTCProbes60KKeySupportLevel
Bitcoin has returned to one of the most important price zones of the current market cycle. The $60,000 level is more than just a round number—it represents a psychological battlefield where long-term investors, institutional buyers, and short-term traders are all watching for confirmation of the next major trend. Every time Bitcoin approaches a key support level, market sentiment becomes divided. Some participants view it as an opportunity to accumulate before the next rally, while others fear that a deeper correction could follow.
As we move through the second ha
BTC1.10%
ETH1.74%
post-image
  • Reward
  • 9
  • 1
  • Share
Falcon_Official:
LFG 🔥
View More
$BTC
The on-chain picture is genuinely remarkable. Long-term holders now control 78.9% to 79% of Bitcoin's circulating supply—an all-time high that dwarfs every previous peak. To put that in perspective, the previous records were 74.5% during the 2022-2023 bottom zone and 71.5% in 2018-2019. And it's still climbing.
At the same time, nearly 11 million BTC are now held at a loss—also a record. But here's the kicker: those underwater coins aren't being sold. Old coin reactivation—dormant BTC moving after long periods of inactivity—stands at just 218,421 BTC year-to-date, the lowest level since
BTC1.10%
User_any
$BTC
The on-chain picture is genuinely remarkable. Long-term holders now control 78.9% to 79% of Bitcoin's circulating supply—an all-time high that dwarfs every previous peak. To put that in perspective, the previous records were 74.5% during the 2022-2023 bottom zone and 71.5% in 2018-2019. And it's still climbing.
At the same time, nearly 11 million BTC are now held at a loss—also a record. But here's the kicker: those underwater coins aren't being sold. Old coin reactivation—dormant BTC moving after long periods of inactivity—stands at just 218,421 BTC year-to-date, the lowest level since 2012. Compare that to 2024, when 1.18 million BTC had been reactivated by June. The conviction holders are literally sitting on their hands.
The Institutional Exodus
On the other side of the ledger, institutional selling has been brutal. Spot Bitcoin ETFs have recorded a cumulative $6 billion to $8 billion in net outflows in 2026. The outflows got so intense that global Bitcoin ETPs posted their first negative one-year flow reading since November 2023. That same signal flashed just weeks before the 2022 cycle bottom.
The selling peaked in early June—a 13-day consecutive outflow streak drained $4.4 billion—but it's been decelerating since. Weekly outflows fell 87% from that peak, dropping from $1.72 billion to roughly $226 million in the most recent full week.
The Divergence That Matters
Here's where it gets interesting. Since June 1, large holders (whales with 10 to 10,000 BTC) have accumulated approximately 270,000 BTC—roughly $20 billion. That's the largest monthly accumulation by any holder class since 2013. The timing is almost too perfect: whales entered accumulation mode right when the ETF outflow streak peaked.
So you've got record ETF selling and record whale buying happening at the same time. The price has followed the sellers so far, dropping from the mid-$70s to around $60,000-$62,000. But as one analyst put it, "the pressure valve is loosening".
What This Setup Means Historically
K33 Research, which tracks this data, says the pattern is consistent with late-stage bear markets. In every prior Bitcoin bear market, supply tilted toward long-term holders as the market approached its trough. The 79% reading is the highest ever recorded and it's spiking rather than flattening.
The critical question: does this resolve as the deepest capitulation in Bitcoin's history (if those conviction holders eventually break), or the tightest supply compression ever recorded heading into the next cycle (if they don't)?
The Technical Reality Right Now
Bitcoin is trading well below its 50-day moving average at $71,160 and its 200-day at $76,360. The RSI sits at 37.3—still in selling pressure territory but not yet deeply oversold. Key support is at $62,500; resistance at $64,700 and $66,500. A sustained move above $66,500 would suggest whale demand is finally overwhelming the remaining ETF selling pressure.
The divergence is real. The question isn't whether the underlying dynamics are shifting. It's whether they've shifted enough to flip the technical regime.
#BTCProbes60KKeySupportLevel
repost-content-media
  • Reward
  • 6
  • 1
  • Share
MrFlower_XingChen:
To The Moon 🌕
View More
#TradFiCFDGoldMasters
#TradFiCFDGoldMasterCompetition The global financial markets continue to present both opportunities and challenges in 2026. Persistent inflation concerns, changing expectations around central bank policies, geopolitical developments, and fluctuating investor sentiment have created an environment where safe-haven assets remain firmly in the spotlight. Among all traditional assets, gold continues to stand out as one of the most closely watched instruments, attracting attention from retail traders, institutional investors, and portfolio managers alike.
Against this backdrop
post-image
post-image
  • Reward
  • 6
  • 1
  • Share
MrFlower_XingChen:
To The Moon 🌕
View More
The cryptocurrency market in 2026 has evolved far beyond simply buying and selling digital assets. Investors are increasingly focusing on strategies that allow their capital to remain productive regardless of whether the market is trending upward, moving sideways, or experiencing periods of uncertainty. This shift has placed stablecoin staking at the center of many portfolio strategies, especially for participants seeking consistent passive income without relying solely on price appreciation.
A staking opportunity offering 9.48% APR stands out because it combines the stability associated with
post-image
  • Reward
  • 6
  • Repost
  • Share
MrFlower_XingChen:
To The Moon 🌕
View More
#USMayPCEInflationRisesTo4.1%HighestIn3Years
The latest U.S. PCE inflation report has become one of the most closely watched economic developments of 2026. With May PCE inflation rising to 4.1%, the highest level in three years, investors are once again reassessing expectations for interest rates, financial markets, and the broader economic outlook. The report serves as a reminder that inflation remains one of the biggest forces shaping global investment decisions, influencing everything from stock valuations to cryptocurrency sentiment.
Understanding PCE Inflation and Why It Matters
The Pers
BTC1.10%
post-image
  • Reward
  • 7
  • Repost
  • Share
MrFlower_XingChen:
To The Moon 🌕
View More
DragonFlyOfficial
#USMayPCEInflationRisesTo4.1%HighestIn3Years
The Inflation Paradox: Why 4.1% PCE Is the Market's Rorschach Test
Three years. That is how long it has been since the Fed's preferred inflation gauge printed above 4%. Yet here we are, staring at a 4.1% PCE reading that just rewrote the narrative for risk assets across the board. Bitcoin briefly touched $58,000, its lowest level since September 2024. Over $1.48 billion in liquidations followed within 24 hours. The dollar surged to 101.52. Gold collapsed to seven-month lows. And somewhere in the chaos, a fundamental question emerged: Is this the beginning of a hawkish nightmare, or merely the market's final capitulation before the next leg up?
The Anchoring Trap
Here is where behavioral finance reveals its cruel irony. The market had anchored itself to the 3.8% April print. When expectations cluster around a specific number, confirmation bias kicks in, traders selectively overweight data that validates their positions, and any deviation triggers disproportionate panic. The 4.1% headline felt like a violation, even though it matched consensus forecasts. This is what I call the "Expectation Asymmetry Framework": markets punish in-line data that feels wrong more severely than they reward genuinely positive surprises.
The cognitive dissonance is palpable. Core PCE at 3.4% is undeniably above the Fed's 2% target. But month-over-month, it held steady at 0.3%. The year-over-year acceleration is largely a base effect from last year's softer comparisons. Yet the narrative machine spun this into a "higher for longer" panic, with CME FedWatch pricing in escalating odds of a July or September rate hike.
The Bullish Case: Liquidity Is Still King
Strip away the noise, and the structural case for crypto remains intact. The US-Iran ceasefire removes a critical supply-side risk from energy markets. Oil prices, which drove much of the headline inflation spike, are already showing signs of stabilization. The Fed's own projections show headline PCE ending 2026 at 3.6%, implying a natural deceleration trajectory even without aggressive intervention.
More importantly, the dollar's surge to one-year highs is a double-edged sword. A stronger dollar tightens global liquidity conditions, yes, but it also increases the probability of coordinated central bank responses. The Bank of Japan's ongoing intervention in yen markets, the ECB's dovish pivot, and China's stimulus measures all create offsetting liquidity injections. Bitcoin has historically bottomed when the dollar peaks, not when it collapses.
Institutional flows tell a different story than the liquidations headline suggests. Spot Bitcoin ETFs saw renewed accumulation in the days preceding the PCE print. The long-term holder cohort continues to absorb supply, with exchange balances hitting multi-year lows. The $58,000 level represents a critical technical confluence, the 200-day moving average and the lower bound of the 2026 trading range. A sustained hold here would mark a higher low formation, the foundation for the next breakout.
The Bearish Case: The Fed's Credibility Crisis
But let us not romanticize the risks. The Fed under Kevin Warsh faces a genuine credibility problem. Having signaled patience in June, the 4.1% print forces a narrative pivot. If the central bank hikes in July or September, risk assets face a liquidity withdrawal that could push Bitcoin below the $50,000 psychological threshold.
The technical picture is equally concerning. Bitcoin's bear flag formation, confirmed by the rejection at broken support, suggests downside targets near $52,000. The correlation between crypto and traditional risk assets has tightened significantly in 2026, meaning a sustained equity selloff would drag digital assets lower regardless of their idiosyncratic merits.
Energy inflation is sticky. Even with the ceasefire, supply chain disruptions from the Middle East conflict have created lasting price pressures. If oil breaches $90 again, the Fed's hand may be forced regardless of underlying economic momentum. Gold's collapse to seven-month lows signals that real yields are repricing higher, a headwind for all non-yielding assets.
The Key Risks
First, the policy error risk: The Fed could overreact to a single inflation print and tighten into a slowing economy. The consumer spending data showed resilience, with personal spending up 0.7%, but this is backward-looking. Leading indicators suggest consumption is rolling over.
Second, the dollar feedback loop: A sustained dollar rally above 102 would trigger emerging market stress, creating risk-off contagion that engulfs crypto. The DXY's correlation with Bitcoin has flipped negative in recent months, meaning dollar strength is now crypto weakness.
Third, the leverage unwind: With over $1.48 billion in liquidations already triggered, the market is in a fragile state. A cascade below $55,000 could trigger systematic selling from risk-parity funds and CTA trend followers.
The Path Forward
The next two weeks are critical. July 4th weekend liquidity will be thin, amplifying volatility. The Fed's July meeting minutes, due in late July, will reveal whether the 4.1% print genuinely shifted the committee's thinking or if this is merely market noise.
My framework suggests we are in a "Macro Compression Phase", where headline volatility masks underlying accumulation. The smart money is not selling into this weakness. They are deploying cash, waiting for the narrative to shift from "higher for longer" to "peak hawkishness."
The PCE print was a test. The market flinched. But flinching is not failing. The traders who survive this regime will be those who understand that 4.1% inflation in a post-pandemic, geopolitically fractured world is not a crisis. It is the new normal. And in that normal, Bitcoin's role as a hedge against monetary uncertainty has never been more relevant.
Watch the $58,000 level. Watch the dollar. Watch the Fed's language shift. The next move will be violent. Make sure you are positioned for the direction that matters, not the noise that distracts.
repost-content-media
  • Reward
  • 5
  • Repost
  • Share
MrFlower_XingChen:
To The Moon 🌕
View More
#MicronOvertakesMetaInMarketValue
The market has delivered one of the biggest surprises of 2026. For years, investors believed that software platforms and social media companies would remain the largest beneficiaries of the AI revolution. Today, the narrative is evolving. Micron has overtaken Meta in market value because investors are increasingly rewarding the companies building the infrastructure that powers artificial intelligence rather than only the applications running on top of it. This is a reminder that every AI model, every inference request, and every large-scale data center depend
post-image
  • Reward
  • 4
  • Repost
  • Share
Crypto_Buzz_with_Alex:
Ape In 🚀
View More
#Get2SharesOfSKHynixAtZeroCost
The semiconductor industry continues to stand at the center of the global artificial intelligence revolution, and SK Hynix has become one of the strongest beneficiaries of this transformation. As demand for AI accelerators, high-performance computing, cloud infrastructure, and next-generation data centers continues to expand throughout 2026, investors are paying increasing attention to companies supplying the advanced memory technologies powering these innovations.
To encourage greater participation in stock trading, Gate has introduced the #Get2SharesOfSKHynixA
post-image
  • Reward
  • 6
  • Repost
  • Share
Crypto_Buzz_with_Alex:
Ape In 🚀
View More
🚨 Community Buzz Today: BTC plunges as massive long liquidations hit — is it time to buy the dip?
📉 BTC briefly dropped to 58,333 USDT
📉 Massive long liquidations swept through the market
📉 Risk-off sentiment is rising
📉 The battle between bulls and bears is heating up
Everyone’s discussing:
🔥 Is this just a shakeout or the start of a bigger downtrend?
🔥 Buy the dip now or wait for further downside?
🔥 Will BTC stage a strong rebound after the liquidations?
🔥 How low do you think this correction will go?
🎁 Join the discussion
Join daily discussions for a chance to win 250U Futu
BTC1.08%
Gate_Square
🚨 Community Buzz Today: BTC plunges as massive long liquidations hit — is it time to buy the dip?
📉 BTC briefly dropped to 58,333 USDT
📉 Massive long liquidations swept through the market
📉 Risk-off sentiment is rising
📉 The battle between bulls and bears is heating up
Everyone’s discussing:
🔥 Is this just a shakeout or the start of a bigger downtrend?
🔥 Buy the dip now or wait for further downside?
🔥 Will BTC stage a strong rebound after the liquidations?
🔥 How low do you think this correction will go?
🎁 Join the discussion
Join daily discussions for a chance to win 250U Futures Position Vouchers!
👉 Join Gate Hot Chat👇
https://gate.onelink.me/Hls0/group?chatroom=group&ref=VVhBVA9a&ref_type=105
repost-content-media
  • Reward
  • 6
  • Repost
  • Share
Crypto_Buzz_with_Alex:
LFG 🔥
View More
BTC market ubdate
317 views
2026-06-27 03:41
  • Reward
  • 2
  • Repost
  • Share
Crypto_Buzz_with_Alex:
To The Moon 🌕
View More
MORNING UBDATE
469 views
2026-06-27 02:26
  • Reward
  • 2
  • Repost
  • Share
Crypto_Buzz_with_Alex:
2026 GOGOGO 👊
View More
#USMayPCEInflationRisesTo4.1%HighestIn3Years
US PCE Inflation Rises to 4.1% in May – Highest Level in Three Years
On June 25, the US Commerce Department announced that the PCE price index for May rose 4.1% year-on-year. This was the highest level seen since April 2023, surpassing the 3.8% increase in April.
Core PCE inflation (excluding food and energy) rose 3.4% year-on-year, reaching its highest level since October 2023.
The main reason for the rise in inflation was attributed to the conflict in the Middle East driving up energy prices. Although a ceasefire has been signed between the US an
ybaser
#USMayPCEInflationRisesTo4.1%HighestIn3Years
US PCE Inflation Rises to 4.1% in May – Highest Level in Three Years
On June 25, the US Commerce Department announced that the PCE price index for May rose 4.1% year-on-year. This was the highest level seen since April 2023, surpassing the 3.8% increase in April.
Core PCE inflation (excluding food and energy) rose 3.4% year-on-year, reaching its highest level since October 2023.
The main reason for the rise in inflation was attributed to the conflict in the Middle East driving up energy prices. Although a ceasefire has been signed between the US and Iran, inflation is expected to remain high for some time.
Following the PCE data, expectations strengthened in the markets that the Fed may raise interest rates in July. As a result:
* The dollar index rose to 101.52, reaching its highest level in about a year.
* Gold prices fell to their lowest levels in about seven months.
The data showed renewed price pressures in the U.S., increasing the likelihood that the Fed will continue with tighter monetary policy; this supported the dollar while putting pressure on gold.
  • Reward
  • 7
  • 2
  • Share
Crypto_Buzz_with_Alex:
LFG 🔥
View More
  • Pinned