# B

2.67M
#B
The market loves explosive rallies. Professional traders ask a different question: Who is buying, and how long can they keep buying?
Today's move in B Token (BUSDT) isn't just another green candle. A 22% daily surge combined with a 74% weekly rally suggests that momentum has shifted decisively in favor of buyers. The real challenge now isn't finding reasons to be bullish—it's determining whether this breakout has enough strength to develop into a sustainable trend.
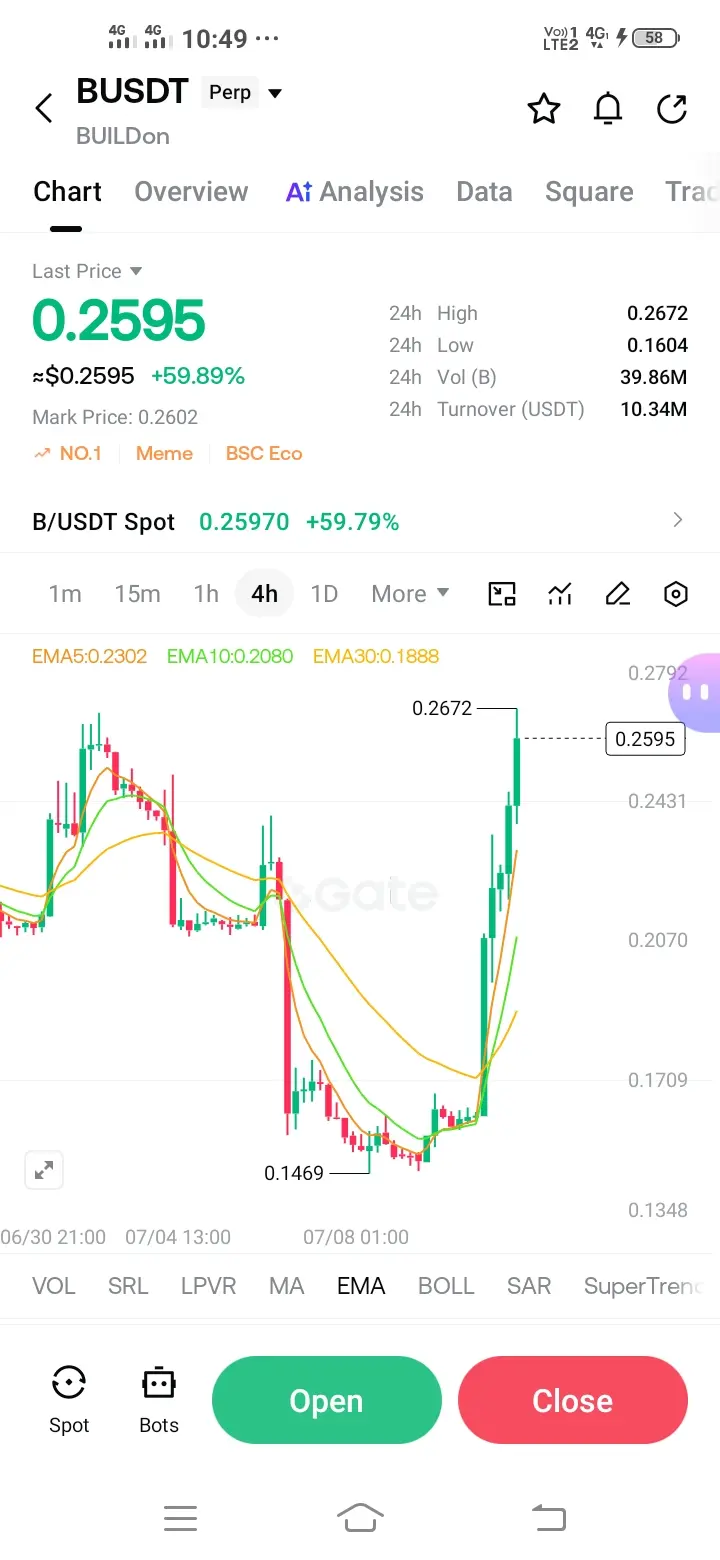
BUSDT is currently trading around 0.2027 USDT, pushing against the highest levels of the day after climbing nearly 22% within
MrFlower_XingChen
#B
The market loves explosive rallies. Professional traders ask a different question: Who is buying, and how long can they keep buying?
Today's move in B Token (BUSDT) isn't just another green candle. A 22% daily surge combined with a 74% weekly rally suggests that momentum has shifted decisively in favor of buyers. The real challenge now isn't finding reasons to be bullish—it's determining whether this breakout has enough strength to develop into a sustainable trend.
BUSDT is currently trading around 0.2027 USDT, pushing against the highest levels of the day after climbing nearly 22% within 24 hours. Such moves usually attract FOMO, but experienced traders know that the first test of resistance often decides whether momentum continues or fades.
What stands out most isn't only the price appreciation—it's the consistency behind it. A gain of more than 73% in one week tells us this wasn't driven by a single pump. Buyers have been accumulating over several sessions, gradually absorbing sell pressure before forcing price into a new trading range.
Momentum Has Returned — Now It Must Be Proven
The current structure clearly favors the bulls.
Price has broken above its recent consolidation zone while trading volume remains healthy, suggesting genuine market participation rather than a temporary liquidity spike.
However, strong momentum alone doesn't guarantee another vertical rally.
Every major breakout eventually reaches a point where early buyers begin taking profits while new buyers decide whether they're willing to pay even higher prices.
That decision is usually made around resistance.
For BUSDT, the immediate battlefield sits near 0.204–0.205 USDT.
A convincing close above this area would strengthen the probability of an extension toward 0.22 USDT, with 0.25 USDT becoming the next realistic objective if buying pressure continues expanding.
The Trend Looks Strong... But The Bigger Picture Still Matters
One statistic deserves more attention than today's rally.
Despite this week's impressive recovery, BUSDT remains significantly below its longer-term highs and is still down sharply over the past year.
That tells us something important.
The market is recovering.
It has not fully recovered.
In strong bull markets, every rally builds on the previous one.
In recovering markets, sharp rallies often alternate with equally aggressive pullbacks.
Understanding that difference helps traders manage expectations instead of emotions.
Where Could Buyers Lose Control?
Bullish momentum remains valid as long as important support levels continue holding.
The first support sits around 0.166 USDT, followed by today's low near 0.163 USDT.
If price falls below this region, it would suggest that short-term momentum traders are beginning to exit their positions.
As long as those supports remain intact, buyers continue controlling the short-term structure.
What I'm Watching Next
I'm not focusing only on price.
I'm watching behavior.
Can BUSDT continue printing higher highs while maintaining healthy trading volume?
Will buyers absorb profit-taking near resistance?
Can momentum remain strong after the initial excitement fades?
Those answers will determine whether this becomes a genuine trend continuation or simply an impressive short-term breakout.
My Market View
At this stage, the advantage clearly belongs to the bulls.
The combination of strong weekly performance, expanding momentum, and improving volume gives buyers the upper hand.
Even so, disciplined traders understand that markets rarely move in straight lines.
A brief consolidation above 0.20 USDT would actually strengthen the bullish structure by allowing momentum to cool before another potential advance.
If buyers successfully defend the current breakout zone, 0.22 USDT becomes the next logical target, while 0.25 USDT could come into focus if momentum accelerates.
Strong trends create opportunities.
Patient execution turns those opportunities into results.
#SummerCreationCamp
@Gate_Square
@GateSquare

repost-content-media
  • Reward
  • Comment
  • Repost
  • Share
#B
The market loves explosive rallies. Professional traders ask a different question: Who is buying, and how long can they keep buying?
Today's move in B Token (BUSDT) isn't just another green candle. A 22% daily surge combined with a 74% weekly rally suggests that momentum has shifted decisively in favor of buyers. The real challenge now isn't finding reasons to be bullish—it's determining whether this breakout has enough strength to develop into a sustainable trend.
BUSDT is currently trading around 0.2027 USDT, pushing against the highest levels of the day after climbing nearly 22% within
MrFlower_XingChen
#B
The market loves explosive rallies. Professional traders ask a different question: Who is buying, and how long can they keep buying?
Today's move in B Token (BUSDT) isn't just another green candle. A 22% daily surge combined with a 74% weekly rally suggests that momentum has shifted decisively in favor of buyers. The real challenge now isn't finding reasons to be bullish—it's determining whether this breakout has enough strength to develop into a sustainable trend.
BUSDT is currently trading around 0.2027 USDT, pushing against the highest levels of the day after climbing nearly 22% within 24 hours. Such moves usually attract FOMO, but experienced traders know that the first test of resistance often decides whether momentum continues or fades.
What stands out most isn't only the price appreciation—it's the consistency behind it. A gain of more than 73% in one week tells us this wasn't driven by a single pump. Buyers have been accumulating over several sessions, gradually absorbing sell pressure before forcing price into a new trading range.
Momentum Has Returned — Now It Must Be Proven
The current structure clearly favors the bulls.
Price has broken above its recent consolidation zone while trading volume remains healthy, suggesting genuine market participation rather than a temporary liquidity spike.
However, strong momentum alone doesn't guarantee another vertical rally.
Every major breakout eventually reaches a point where early buyers begin taking profits while new buyers decide whether they're willing to pay even higher prices.
That decision is usually made around resistance.
For BUSDT, the immediate battlefield sits near 0.204–0.205 USDT.
A convincing close above this area would strengthen the probability of an extension toward 0.22 USDT, with 0.25 USDT becoming the next realistic objective if buying pressure continues expanding.
The Trend Looks Strong... But The Bigger Picture Still Matters
One statistic deserves more attention than today's rally.
Despite this week's impressive recovery, BUSDT remains significantly below its longer-term highs and is still down sharply over the past year.
That tells us something important.
The market is recovering.
It has not fully recovered.
In strong bull markets, every rally builds on the previous one.
In recovering markets, sharp rallies often alternate with equally aggressive pullbacks.
Understanding that difference helps traders manage expectations instead of emotions.
Where Could Buyers Lose Control?
Bullish momentum remains valid as long as important support levels continue holding.
The first support sits around 0.166 USDT, followed by today's low near 0.163 USDT.
If price falls below this region, it would suggest that short-term momentum traders are beginning to exit their positions.
As long as those supports remain intact, buyers continue controlling the short-term structure.
What I'm Watching Next
I'm not focusing only on price.
I'm watching behavior.
Can BUSDT continue printing higher highs while maintaining healthy trading volume?
Will buyers absorb profit-taking near resistance?
Can momentum remain strong after the initial excitement fades?
Those answers will determine whether this becomes a genuine trend continuation or simply an impressive short-term breakout.
My Market View
At this stage, the advantage clearly belongs to the bulls.
The combination of strong weekly performance, expanding momentum, and improving volume gives buyers the upper hand.
Even so, disciplined traders understand that markets rarely move in straight lines.
A brief consolidation above 0.20 USDT would actually strengthen the bullish structure by allowing momentum to cool before another potential advance.
If buyers successfully defend the current breakout zone, 0.22 USDT becomes the next logical target, while 0.25 USDT could come into focus if momentum accelerates.
Strong trends create opportunities.
Patient execution turns those opportunities into results.
#SummerCreationCamp
@Gate_Square
@GateSquare
repost-content-media
  • Reward
  • 8
  • Repost
  • Share
ThisIsTranslateContent::
DYOR 🤓
View More
#B
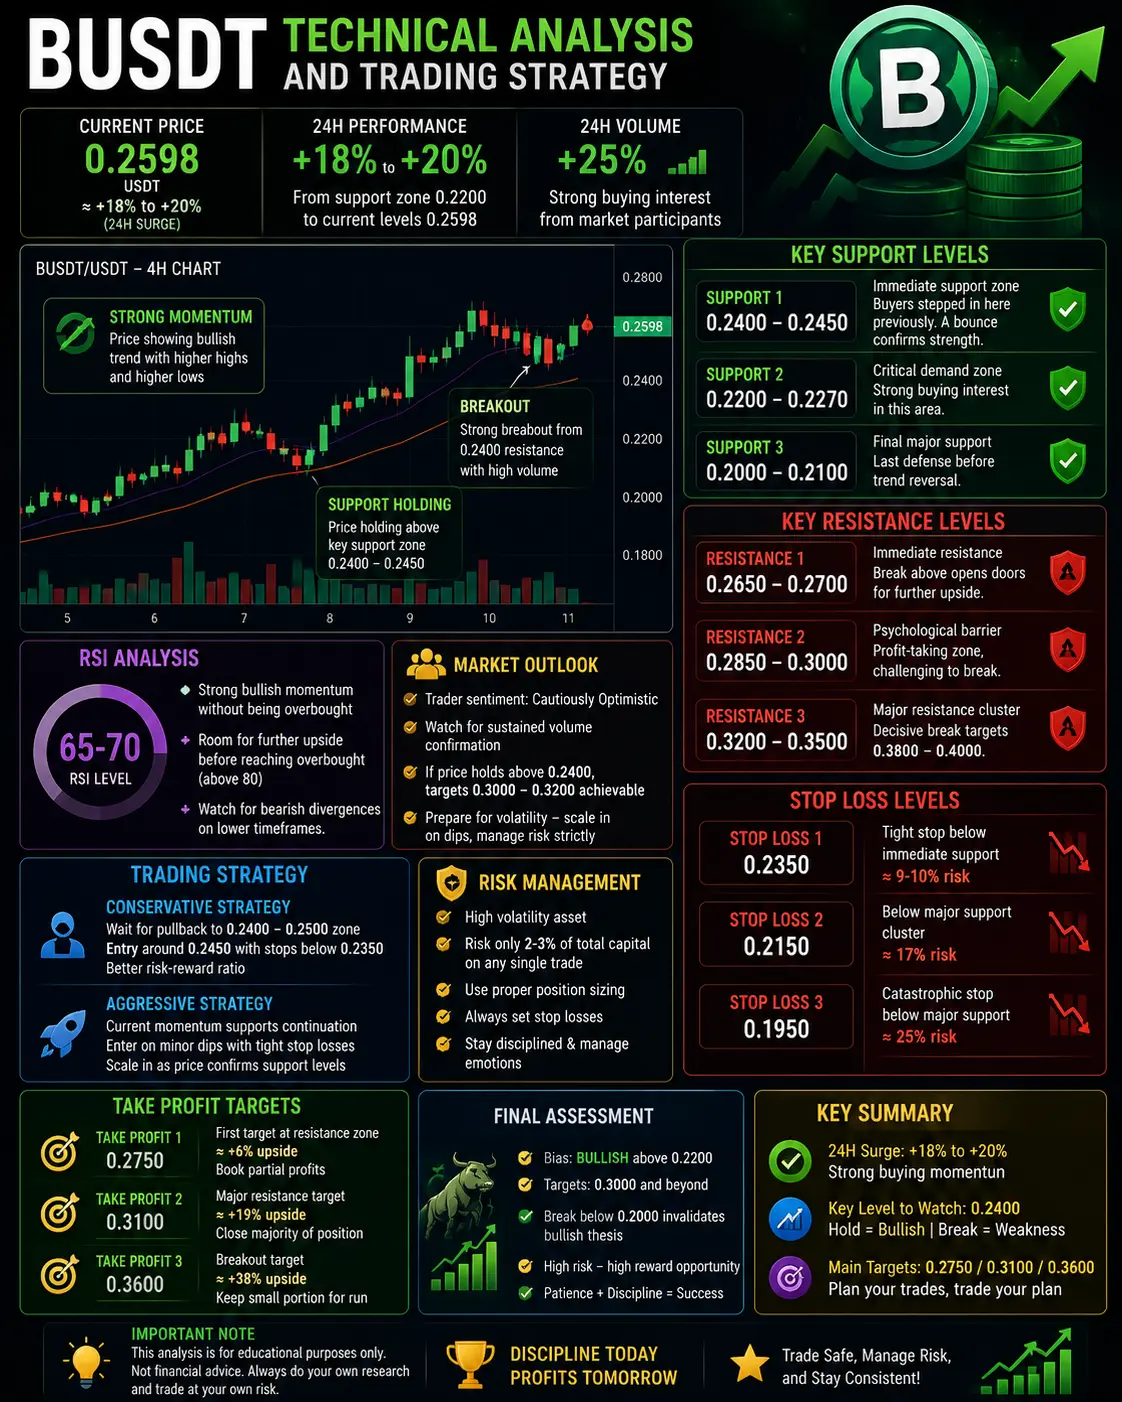
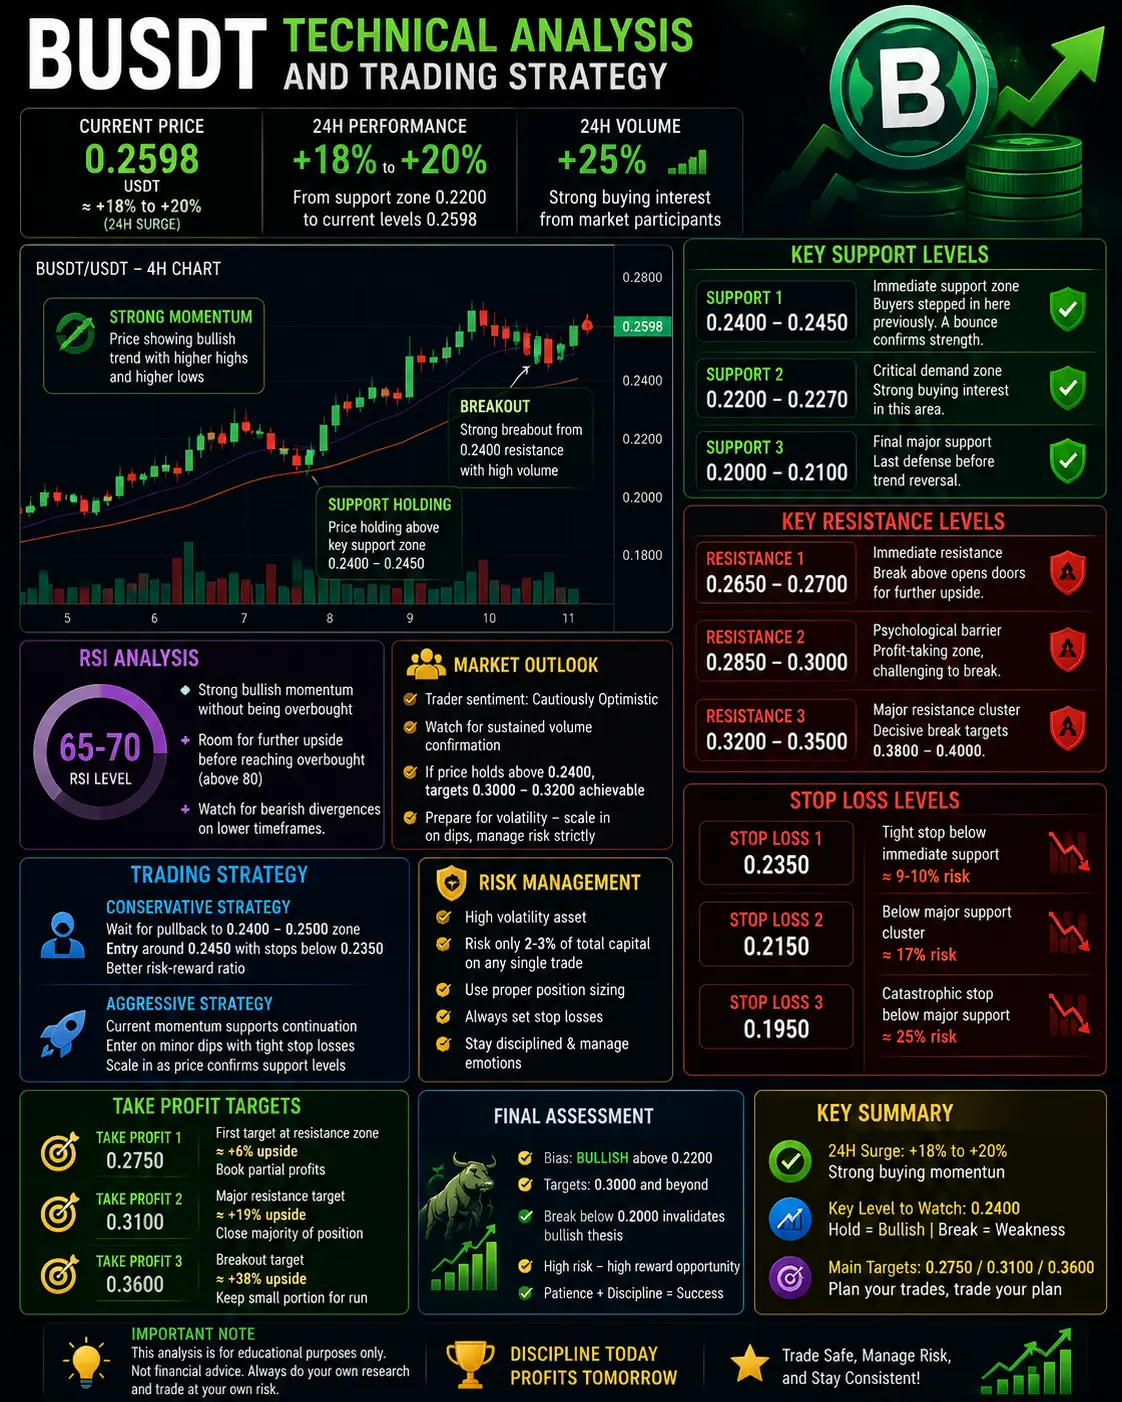
Over the past 24 hours, BUSDT has demonstrated significant percentage gains. The token has moved from lower support zones around 0.2200 to current levels near 0.2598, representing a substantial surge of approximately 18-20% in a single day. Volume spikes have been observed, with some sessions showing increased trading activity of over 25%, indicating strong interest from both retail and institutional participants.
Key Support Levels
Support Level 1: 0.2400 - 0.2450 zone acts as immediate support where buyers have previously stepped in. This level represents recent consolidation areas and s
HighAmbition
#B
Over the past 24 hours, BUSDT has demonstrated significant percentage gains. The token has moved from lower support zones around 0.2200 to current levels near 0.2598, representing a substantial surge of approximately 18-20% in a single day. Volume spikes have been observed, with some sessions showing increased trading activity of over 25%, indicating strong interest from both retail and institutional participants.
Key Support Levels
Support Level 1: 0.2400 - 0.2450 zone acts as immediate support where buyers have previously stepped in. This level represents recent consolidation areas and should hold for bullish continuation. A bounce from this zone would confirm healthy price action.
Support Level 2: 0.2200 - 0.2270 is a critical demand zone. This area has historically attracted significant buying interest and serves as a major support cluster. A break below this level could trigger deeper corrections toward lower support areas.
Support Level 3: 0.2000 - 0.2100 represents the final major support. This zone has shown strong accumulation in previous sessions and would be the last defense before a potential trend reversal. Traders are watching this level closely for any signs of breakdown.
Key Resistance Levels
Resistance Level 1: 0.2650 - 0.2700 is the immediate overhead resistance. Breaking above this level would open doors for further upside movement toward higher targets. This zone requires sustained volume to overcome.
Resistance Level 2: 0.2850 - 0.3000 represents a psychological barrier where profit-taking typically occurs. Many traders have positioned sell orders in this range, making it a challenging level to break without strong momentum.
Resistance Level 3: 0.3200 - 0.3500 is the major resistance cluster. A decisive break above this range would confirm a strong bullish trend with targets extending toward the 0.3800 - 0.4000 area.
RSI Analysis
The Relative Strength Index for BUSDT is currently hovering around 65-70 levels, indicating strong bullish momentum without being extremely overbought. This suggests there is still room for further upside before reaching technically overbought conditions above 80. However, traders should watch for bearish divergences on lower timeframes as early warning signals for potential pullbacks.
Trading Strategy Recommendations
For conservative traders, waiting for a pullback toward the 0.2400 - 0.2500 support zone before entering long positions would be prudent. This approach provides better risk-reward ratios and reduces the chance of buying at local tops. Entry around 0.2450 with stops below 0.2350 offers a favorable setup.
For aggressive traders, current momentum supports continuation plays with tight stop losses. The strategy involves entering on minor dips while maintaining strict risk management protocols. Scaling into positions as price confirms support levels is recommended.
Stop Loss Levels
Stop Loss 1: 0.2350 - This tight stop protects capital if immediate support fails and represents approximately 9-10% risk from current levels. Suitable for short-term scalpers.
Stop Loss 2: 0.2150 - A moderate stop placed below the second major support cluster, offering more breathing room for normal market fluctuations. This represents about 17% risk.
Stop Loss 3: 0.1950 - This is the catastrophic stop level placed well below major support, protecting against complete trend reversals. Risk of approximately 25% from entry.
Take Profit Targets
Take Profit 1: 0.2750 - The first target captures gains at the immediate resistance zone and represents a reasonable 6% upside from current levels. Partial profit booking recommended here.
Take Profit 2: 0.3100 - The second target aligns with major resistance and offers approximately 19% potential returns. This is where majority of position can be closed.
Take Profit 3: 0.3600 - The ambitious target assumes a full breakout scenario with sustained bullish momentum, offering potential gains exceeding 38%. Reserve a small portion for this target.
Market Sentiment and Trader Outlook
Trader sentiment on BUSDT remains cautiously optimistic following the 24-hour surge. The community is watching for sustained volume confirmation before committing to larger positions. Many traders are employing a strategy of scaling into positions on dips rather than chasing pumps.
The general consensus suggests that if BUSDT maintains above the 0.2400 level, further upside toward the 0.3000 - 0.3200 range is achievable. However, traders are also preparing for potential volatility as the token has shown rapid price movements in both directions.
Risk management remains paramount given the token's volatility characteristics. Position sizing should reflect the high-risk nature of this asset, with no single trade risking more than 2-3% of total trading capital.
Final Assessment
BUSDT presents both opportunity and risk at current levels. The 24-hour surge indicates strong underlying demand, but traders should remain cautious of potential pullbacks. The optimal approach combines patience for better entry points with disciplined execution of stop loss and take profit levels. Traders should remain flexible and adjust positions based on how price reacts at key technical levels in the coming sessions.
The bias remains bullish as long as price holds above 0.2200, with targets extending toward 0.3000 and beyond. Any break below 0.2000 would invalidate the bullish thesis and suggest a deeper correction is underway.
repost-content-media
  • Reward
  • 6
  • Repost
  • Share
SheenCrypto:
2026 GOGOGO 👊
View More
#B
Over the past 24 hours, BUSDT has demonstrated significant percentage gains. The token has moved from lower support zones around 0.2200 to current levels near 0.2598, representing a substantial surge of approximately 18-20% in a single day. Volume spikes have been observed, with some sessions showing increased trading activity of over 25%, indicating strong interest from both retail and institutional participants.
Key Support Levels
Support Level 1: 0.2400 - 0.2450 zone acts as immediate support where buyers have previously stepped in. This level represents recent consolidation areas and s
post-image
post-image
  • Reward
  • 23
  • Repost
  • Share
My_Power:
To The Moon 🌕
View More
🔥 B/USDT Continues Strong Bullish Expansion
📍 Price: $0.6527
📈 24H Gain: +37.93%
💰 Volume: 32.68M
B continues attracting strong buyer participation with healthy volume and positive market structure 📈
The bullish trend remains active as momentum traders continue supporting the rally.
⚠️ Rapid market swings may increase short-term volatility.
#B #Altcoins #CryptoTrading #Bullish #GateSquareMayTradingShare 🚀$B $SAGA $USELESS
B0.61%
SAGA5.86%
USELESS2.87%
post-image
post-image
  • Reward
  • Comment
  • Repost
  • Share
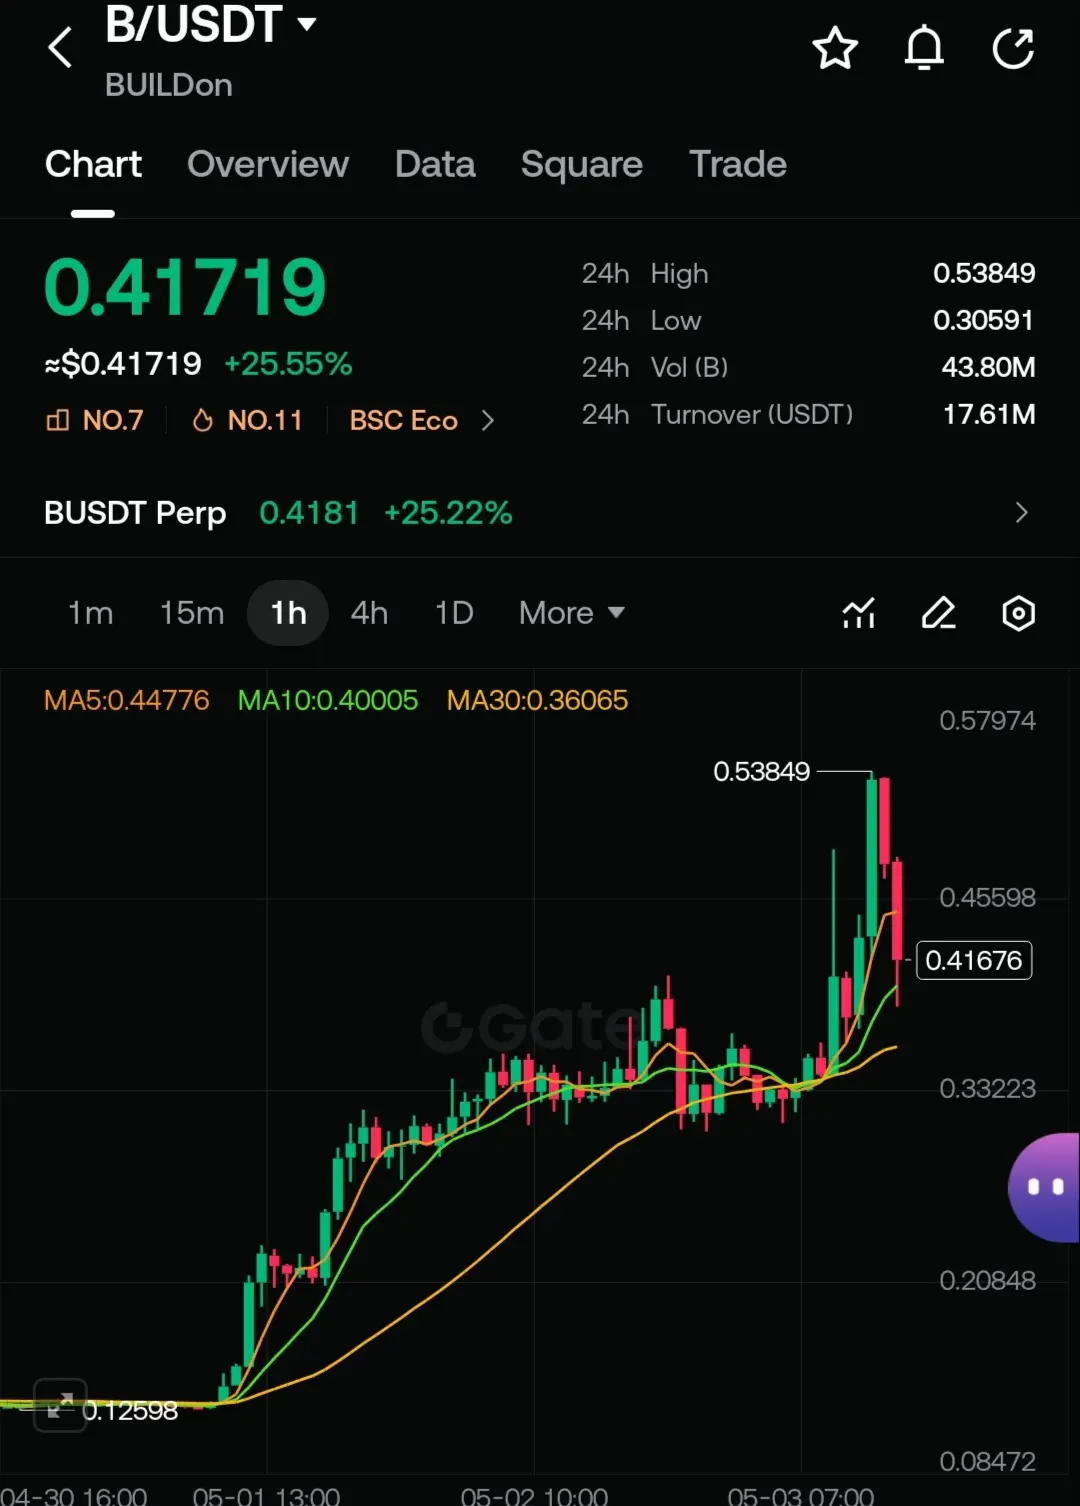
$B is picking up steam ... hovering near $0.41719, and this pocket is where price action can turn on a dime. Bulls are scooping dips, and as long as this level holds, we could see B gear up for a solid breakout attempt. If it slips, watch for a sharp dip to reset before the next leg up.

Buy Zone: $0.416 – $0.418
TP 1: $0.447
TP 2: $0.482
TP 3: $0.538
SL: $0.400
#B #Rmj-Trades
B0.87%
post-image
  • Reward
  • 1
  • Repost
  • Share
HanJiangGuYing:
Already translated
$B
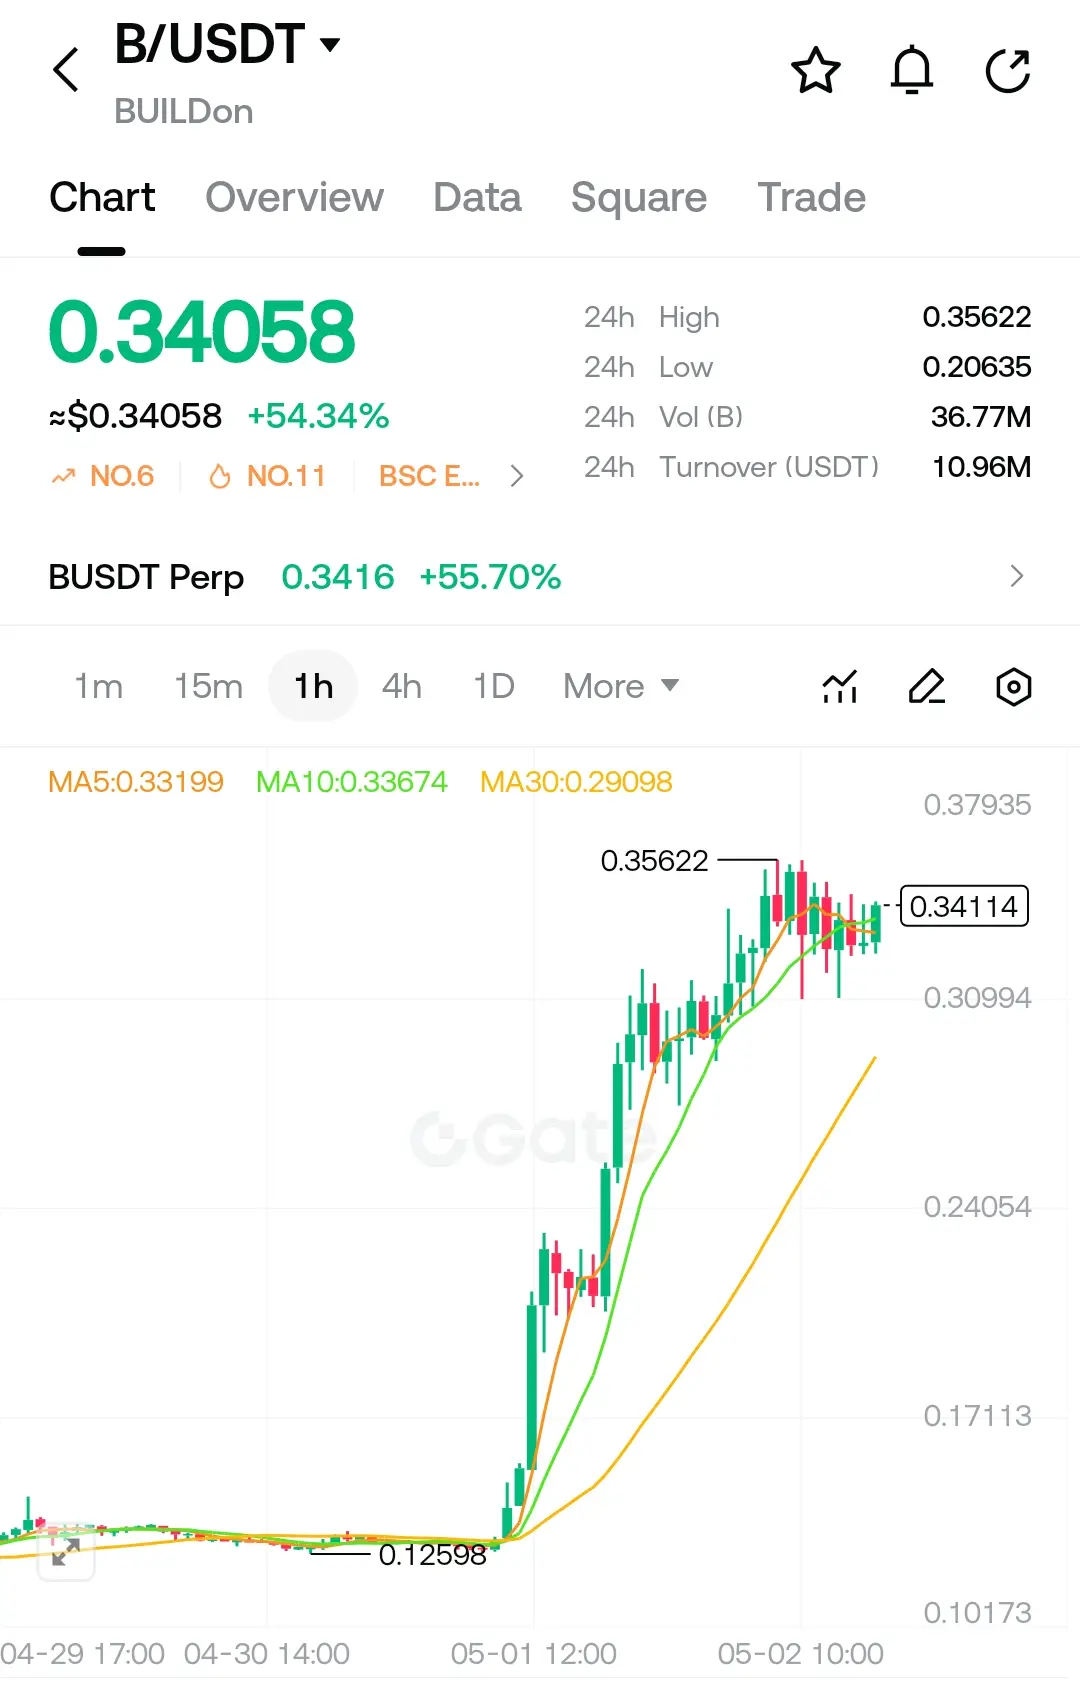
Strong trend structure. Price holding above MA30, coiling below recent highs. Volume steady.
• Entry Zone: 0.3320 - 0.3405
• TP1: 0.3562
• TP2: 0.3700
• TP3: 0.3850
• Stop-Loss: 0.3200
Momentum intact above 0.3319. Breakout risk above 0.3562. Lose 0.2909 and trend weakens.
#B #WCTCTradingKingPK #USSeeksStrategicBitcoinReserve #BitcoinETFOptionLimitQuadruples #FedHoldsRateButDividesDeepen
B0.87%
post-image
  • Reward
  • 2
  • Repost
  • Share
Yajing:
To The Moon 🌕
View More
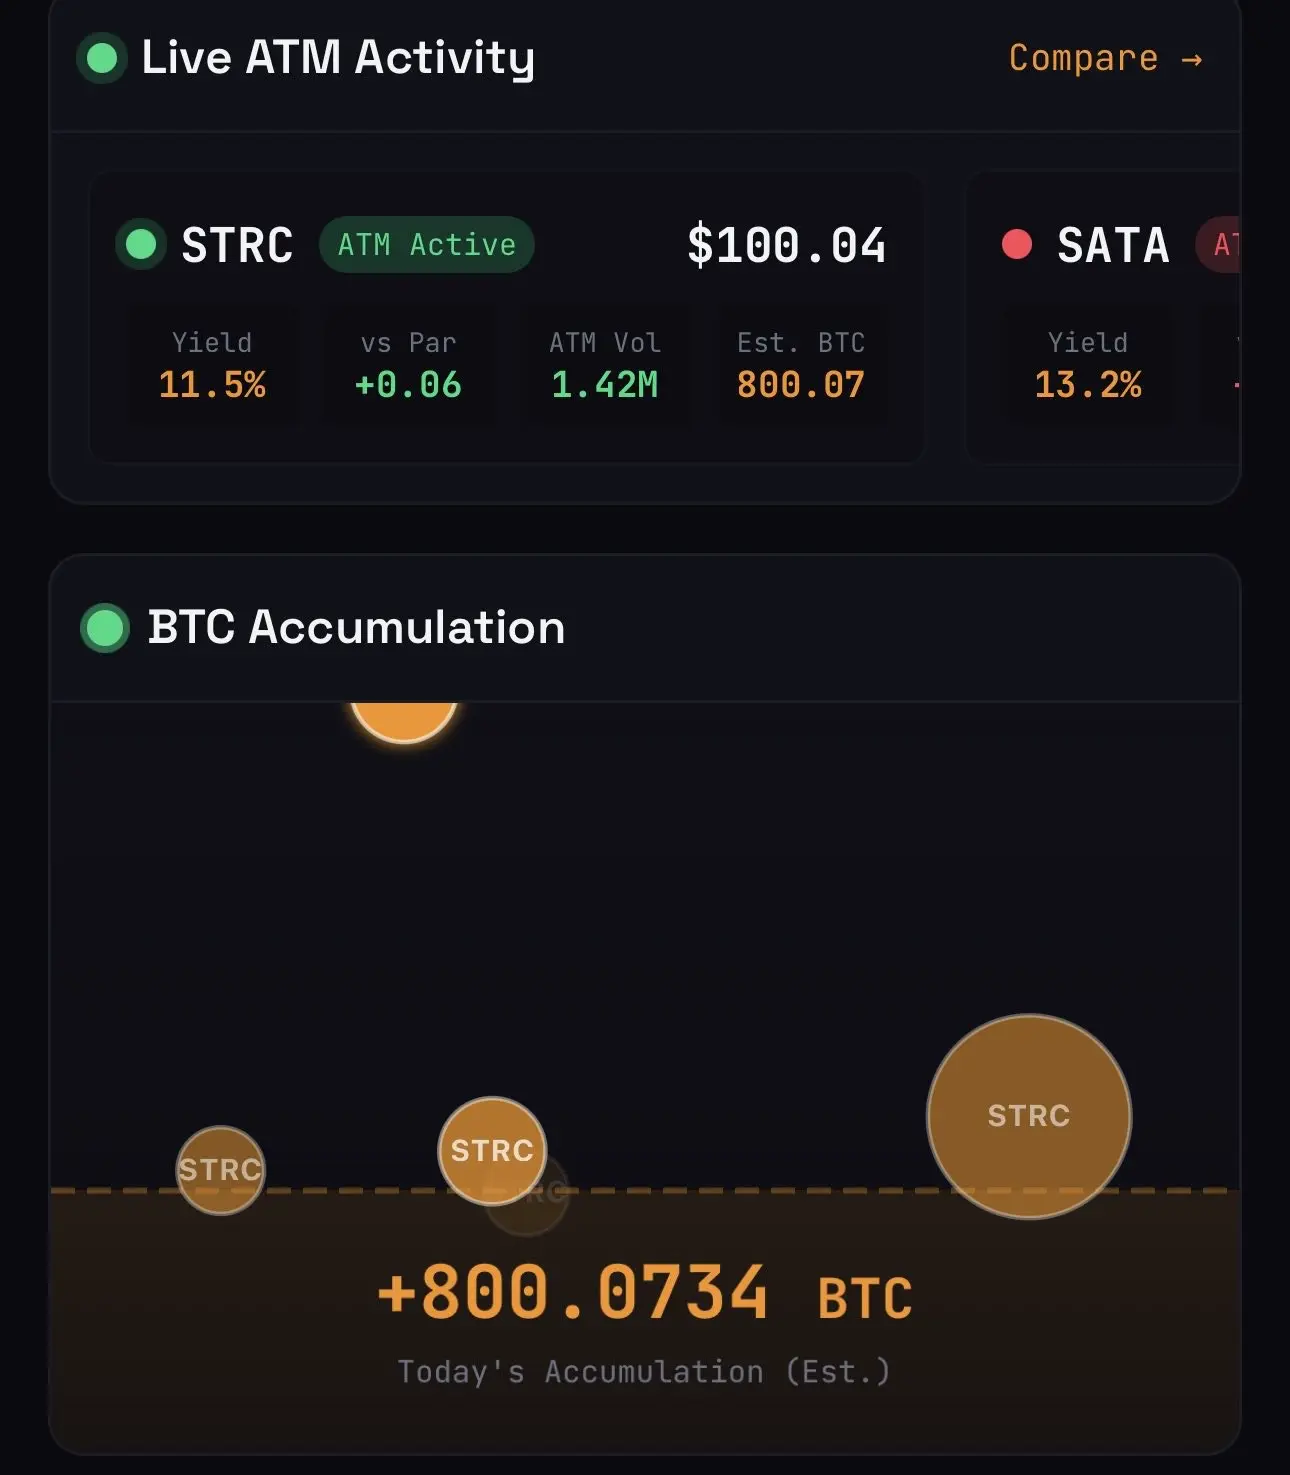
It's now estimated that #michaelsaylor strategy has already accumulated over 800 #BTC today.
#B
#Bitcoin #GateFebruaryTransparencyReport
BTC1.73%
post-image
  • Reward
  • Comment
  • Repost
  • Share
#B Short position entered, stop loss above 0.7, aiming for 50 points with a 10-point risk.
View Original
  • Reward
  • Comment
  • Repost
  • Share
#B Phoenix— it’s broken the level three times and bounced back again!
You can’t short this coin; it’s another coin that crushes shorts/short-sellers.
View Original
  • Reward
  • Comment
  • Repost
  • Share
Load More

Join 40 M users in our growing community

⚡️ Join 40 M users in the crypto craze discussion
💬 Engage with your favorite top creators
👍 See what interests you
  • Pinned