#TLM #SummerCreationCamp
#夏日创作营 TLM Alien Worlds
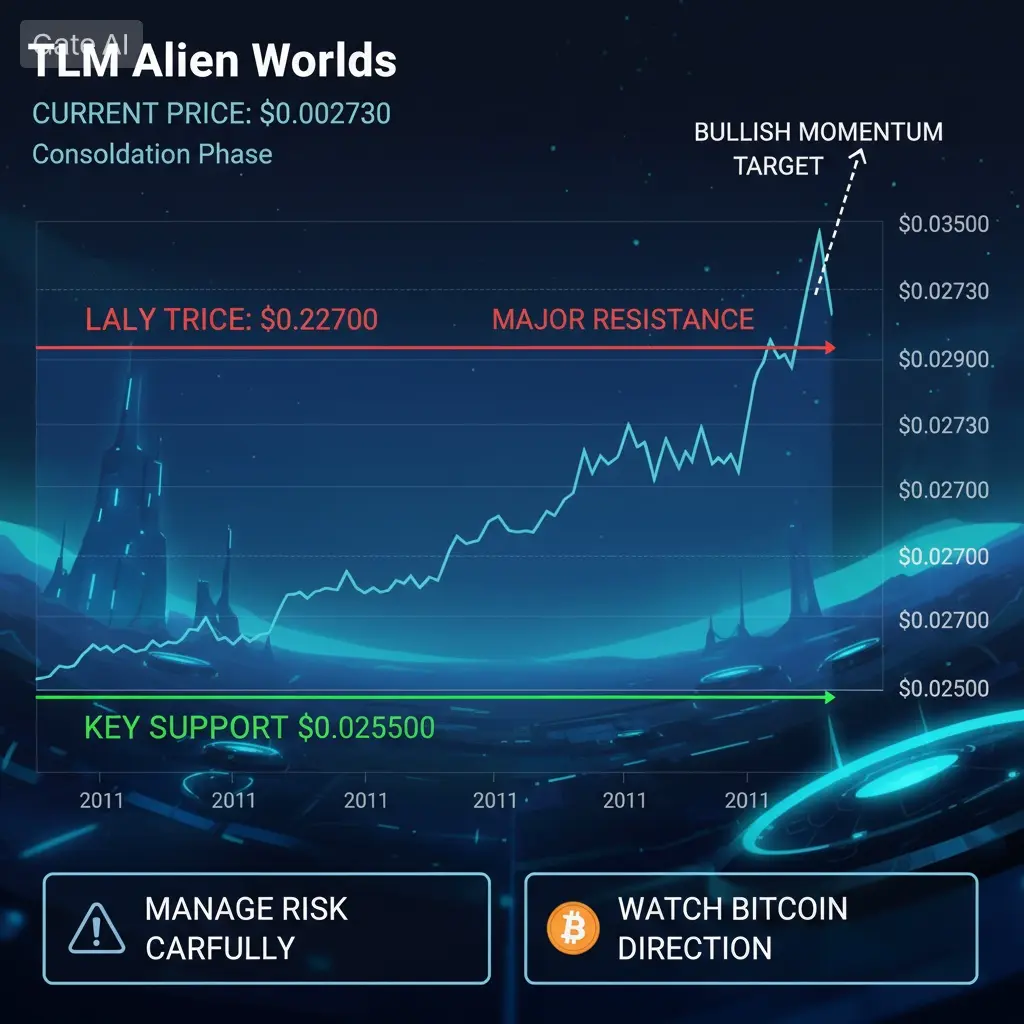
TLM is currently trading around $0.002730, showing a modest recovery after an extended period of weakness. Although the token remains far below its historical peak, recent price action suggests that sellers are gradually losing momentum while buyers continue defending important support zones. The broader cryptocurrency market, especially Bitcoin's direction, remains the biggest factor influencing TLM's short-term movement. If market sentiment improves, low-cap gaming tokens such as TLM could experience stronger percentage gains than many large-cap cryptocurrencies.
Current Market Structure
TLM continues to trade inside a long-term consolidation range after months of heavy selling pressure. Price volatility remains elevated, but recent candles indicate accumulation rather than panic selling. Trading volume has stabilized, suggesting that long-term holders are slowly accumulating while speculative selling has eased.
Although momentum remains moderate, maintaining support above current levels would improve confidence for a gradual recovery.
Technical Analysis
Key Support Levels
SL1: $0.002500
This is the first and most important short-term support. Buyers have defended this area several times, making it the level traders should monitor closely.
SL2: $0.002300
Historical accumulation zone. If price revisits this level, stronger buying interest may appear.
SL3: $0.002000
Major psychological support. Losing this level could trigger another wave of selling and delay any recovery.
Key Resistance Levels
RL1: $0.002900
Immediate resistance where sellers recently entered the market.
RL2: $0.003200
A breakout above this level would improve bullish momentum significantly.
RL3: $0.003500
Major resistance. Closing above this level would confirm a stronger trend reversal and could attract additional buyers.
RSI & Momentum Analysis
The 14-day RSI remains near the neutral zone (45-55).
This indicates:
• The market is neither overbought nor oversold.
• Buyers still have room to push prices higher.
• Selling momentum continues to weaken.
• A rise above RSI 60 could signal increasing bullish momentum.
Meanwhile, MACD is attempting to stabilize, suggesting bearish momentum is gradually fading after the previous correction.
Price Forecast
Short-Term (1-4 Weeks)
Target 1: $0.003000 Approximately 10% upside
Target 2: $0.003500 Around 28% upside
Target 3: $0.004200 Potential 54% upside if overall crypto sentiment improves.
Medium-Term Outlook
If Bitcoin remains stable and gaming tokens regain momentum, TLM could revisit previous resistance zones during the coming months.
Several analysts continue expecting gradual recovery if blockchain gaming activity expands throughout 2026.
Long-Term Outlook
Long-term projections remain highly speculative, but optimistic forecasts continue suggesting meaningful upside if:
• Web3 gaming adoption accelerates
• NFT activity recovers
• Metaverse narratives return
• Alien Worlds expands ecosystem utility
Trading Strategy
Conservative Traders
Wait for pullbacks near $0.002500 before entering.
Use gradual accumulation instead of buying everything at once.
Stop-loss below $0.002000.
Moderate Traders
Current prices remain reasonable for partial entries.
Consider adding more if price revisits support.
Take profits gradually at:
• $0.003000
• $0.003500
• $0.004200
Aggressive Traders
Momentum traders may consider buying only after a confirmed breakout above $0.003000, supported by higher trading volume.
Bullish Factors
• Gaming sector showing early recovery signals.
• Alien Worlds continues ecosystem
development.
• Strong community support.
• Low valuation creates attractive risk-reward opportunities.
• Potential return of NFT and metaverse narratives.
• Historical volatility shows TLM can produce strong percentage rallies during bullish cycles.
Bearish Risks
• Altcoin market remains sensitive to Bitcoin volatility.
• Trading volume remains relatively low compared with previous cycles.
• Heavy historical drawdown still affects investor confidence.
• Broader macroeconomic uncertainty continues impacting speculative assets.
• Failure to hold $0.002500 could increase selling pressure.
Project Overview
Alien Worlds remains one of the largest blockchain gaming ecosystems, combining NFTs, DeFi, and play-to-earn mechanics across multiple blockchains including Ethereum
TLM powers the ecosystem through:
• Governance voting
• Staking rewards
• NFT upgrades
• Cross-chain transfers
• In-game mining rewards
As blockchain gaming continues evolving, the utility of TLM could strengthen if user activity and ecosystem participation increase.
Token Metrics
Current Price: $0.002730
Market Cap: ~$16.15M
Circulating Supply: 5.74B TLM
24H Volume: ~$4.67M
Final Verdict
TLM remains a high-risk high-reward cryptocurrency. While the token continues trading near historically low levels, it also offers significant upside potential if blockchain gaming, NFTs, and the metaverse regain investor attention.
For now, traders should closely monitor $0.002500 support and $0.003000 resistance. A successful breakout above resistance could signal the beginning of a stronger recovery, while losing key support would increase downside risk.
@Gate_Square
#夏日创作营 TLM Alien Worlds
TLM is currently trading around $0.002730, showing a modest recovery after an extended period of weakness. Although the token remains far below its historical peak, recent price action suggests that sellers are gradually losing momentum while buyers continue defending important support zones. The broader cryptocurrency market, especially Bitcoin's direction, remains the biggest factor influencing TLM's short-term movement. If market sentiment improves, low-cap gaming tokens such as TLM could experience stronger percentage gains than many large-cap cryptocurrencies.
Current Market Structure
TLM continues to trade inside a long-term consolidation range after months of heavy selling pressure. Price volatility remains elevated, but recent candles indicate accumulation rather than panic selling. Trading volume has stabilized, suggesting that long-term holders are slowly accumulating while speculative selling has eased.
Although momentum remains moderate, maintaining support above current levels would improve confidence for a gradual recovery.
Technical Analysis
Key Support Levels
SL1: $0.002500
This is the first and most important short-term support. Buyers have defended this area several times, making it the level traders should monitor closely.
SL2: $0.002300
Historical accumulation zone. If price revisits this level, stronger buying interest may appear.
SL3: $0.002000
Major psychological support. Losing this level could trigger another wave of selling and delay any recovery.
Key Resistance Levels
RL1: $0.002900
Immediate resistance where sellers recently entered the market.
RL2: $0.003200
A breakout above this level would improve bullish momentum significantly.
RL3: $0.003500
Major resistance. Closing above this level would confirm a stronger trend reversal and could attract additional buyers.
RSI & Momentum Analysis
The 14-day RSI remains near the neutral zone (45-55).
This indicates:
• The market is neither overbought nor oversold.
• Buyers still have room to push prices higher.
• Selling momentum continues to weaken.
• A rise above RSI 60 could signal increasing bullish momentum.
Meanwhile, MACD is attempting to stabilize, suggesting bearish momentum is gradually fading after the previous correction.
Price Forecast
Short-Term (1-4 Weeks)
Target 1: $0.003000 Approximately 10% upside
Target 2: $0.003500 Around 28% upside
Target 3: $0.004200 Potential 54% upside if overall crypto sentiment improves.
Medium-Term Outlook
If Bitcoin remains stable and gaming tokens regain momentum, TLM could revisit previous resistance zones during the coming months.
Several analysts continue expecting gradual recovery if blockchain gaming activity expands throughout 2026.
Long-Term Outlook
Long-term projections remain highly speculative, but optimistic forecasts continue suggesting meaningful upside if:
• Web3 gaming adoption accelerates
• NFT activity recovers
• Metaverse narratives return
• Alien Worlds expands ecosystem utility
Trading Strategy
Conservative Traders
Wait for pullbacks near $0.002500 before entering.
Use gradual accumulation instead of buying everything at once.
Stop-loss below $0.002000.
Moderate Traders
Current prices remain reasonable for partial entries.
Consider adding more if price revisits support.
Take profits gradually at:
• $0.003000
• $0.003500
• $0.004200
Aggressive Traders
Momentum traders may consider buying only after a confirmed breakout above $0.003000, supported by higher trading volume.
Bullish Factors
• Gaming sector showing early recovery signals.
• Alien Worlds continues ecosystem
development.
• Strong community support.
• Low valuation creates attractive risk-reward opportunities.
• Potential return of NFT and metaverse narratives.
• Historical volatility shows TLM can produce strong percentage rallies during bullish cycles.
Bearish Risks
• Altcoin market remains sensitive to Bitcoin volatility.
• Trading volume remains relatively low compared with previous cycles.
• Heavy historical drawdown still affects investor confidence.
• Broader macroeconomic uncertainty continues impacting speculative assets.
• Failure to hold $0.002500 could increase selling pressure.
Project Overview
Alien Worlds remains one of the largest blockchain gaming ecosystems, combining NFTs, DeFi, and play-to-earn mechanics across multiple blockchains including Ethereum
TLM powers the ecosystem through:
• Governance voting
• Staking rewards
• NFT upgrades
• Cross-chain transfers
• In-game mining rewards
As blockchain gaming continues evolving, the utility of TLM could strengthen if user activity and ecosystem participation increase.
Token Metrics
Current Price: $0.002730
Market Cap: ~$16.15M
Circulating Supply: 5.74B TLM
24H Volume: ~$4.67M
Final Verdict
TLM remains a high-risk high-reward cryptocurrency. While the token continues trading near historically low levels, it also offers significant upside potential if blockchain gaming, NFTs, and the metaverse regain investor attention.
For now, traders should closely monitor $0.002500 support and $0.003000 resistance. A successful breakout above resistance could signal the beginning of a stronger recovery, while losing key support would increase downside risk.
@Gate_Square