$SYRUP /USDT: Reading the Signs on This Rally
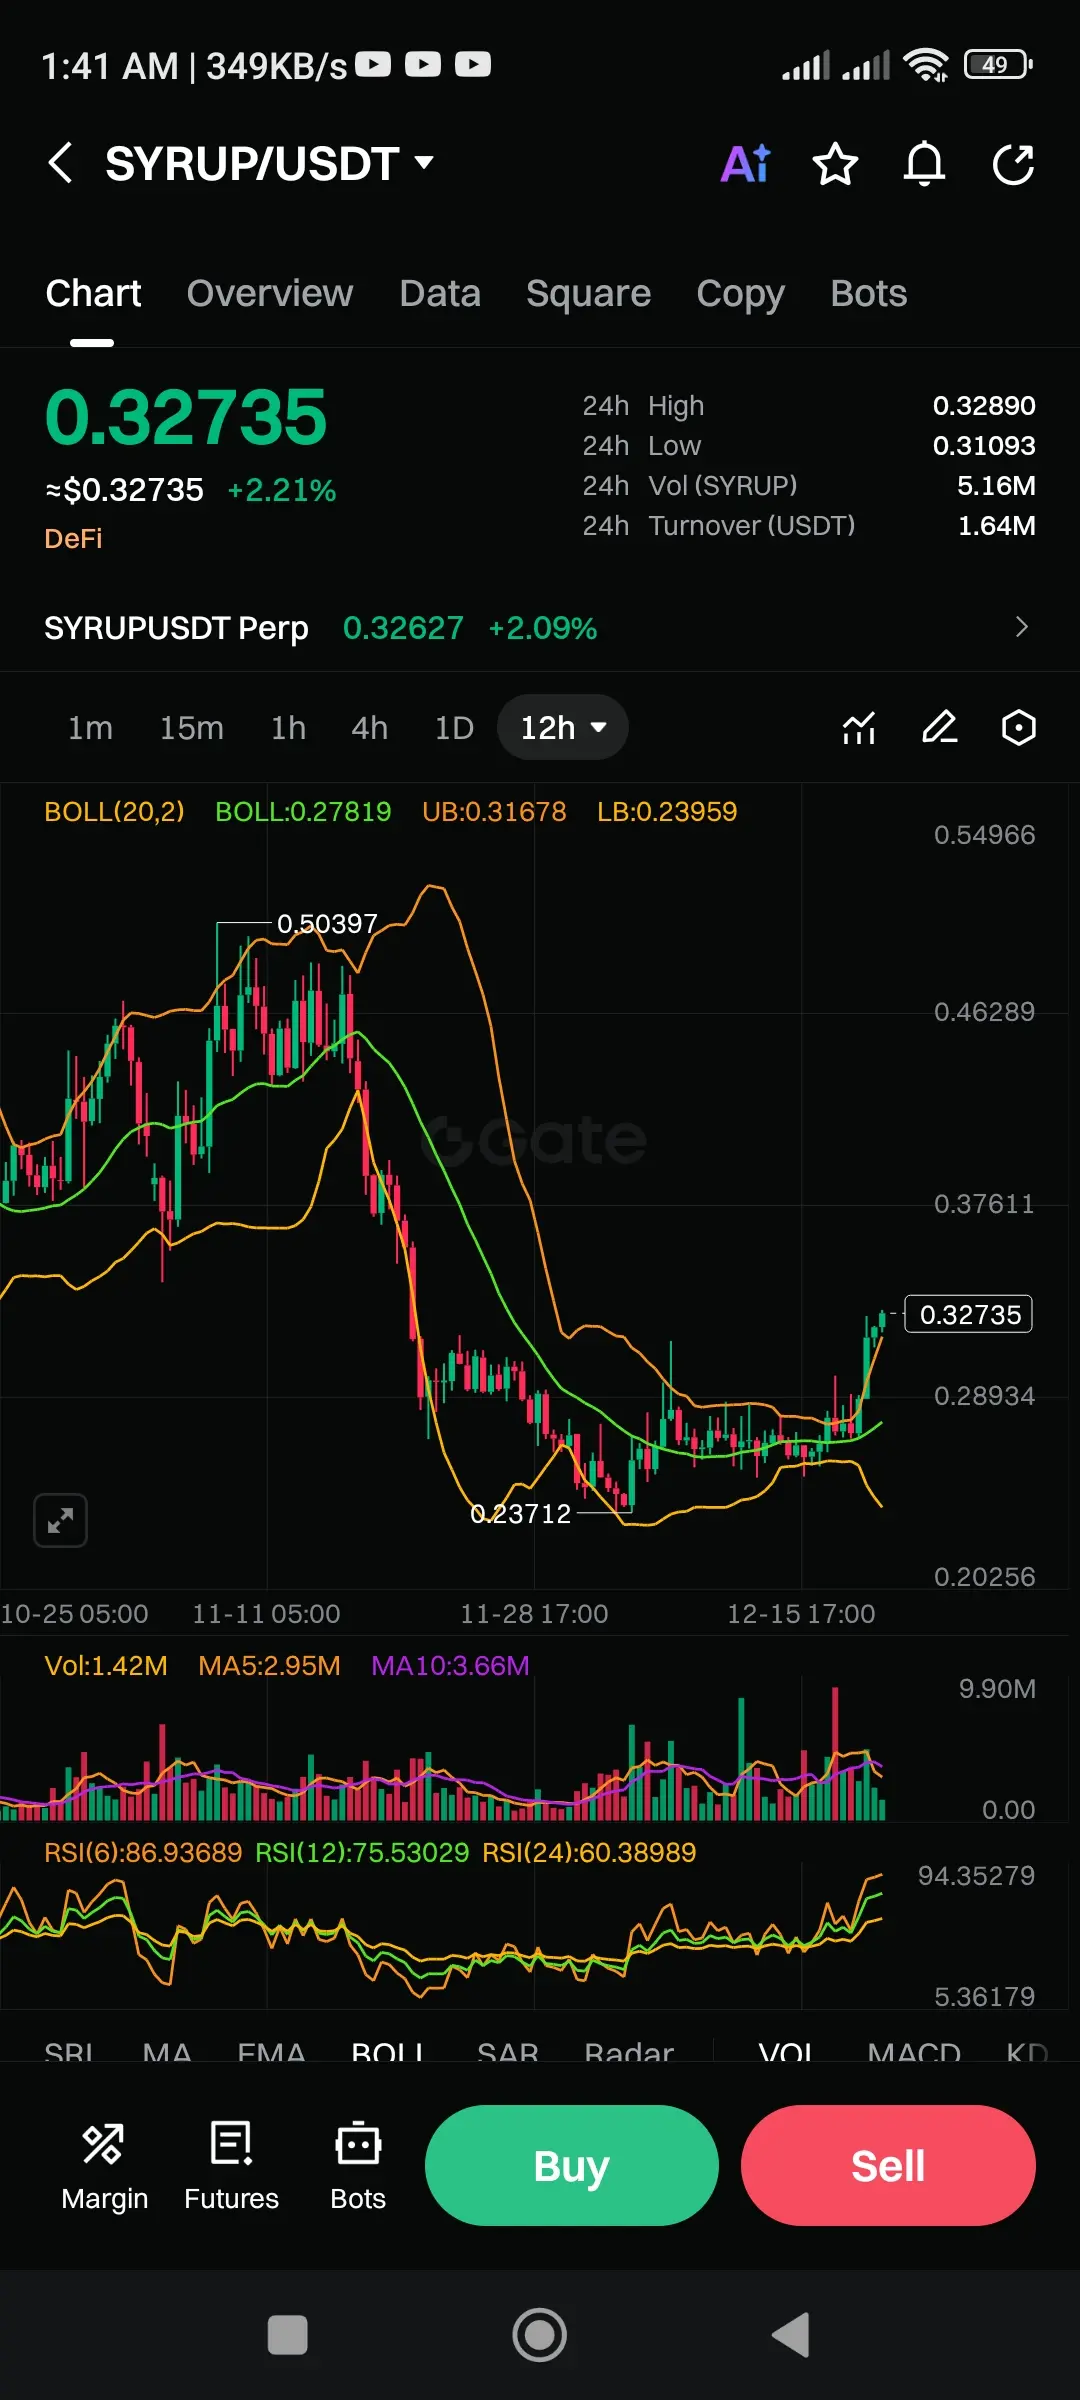
Current Price: $0.32735 (up 2.21%)
24h Range: $0.31093 - $0.32890
Trading Activity: 5.16M SYRUP moved ($1.64M in value)
What the Chart Is Telling Us
Looking at this 12-hour view, SYRUP has been on quite a journey. After dropping sharply from around $0.50 back in late October, it found a bottom near $0.24 in mid-November. Since then, it's been quietly building strength—and now it's breaking out.
Here's what stands out:
The recent surge: Price just climbed back above the orange Bollinger Band line (currently at $0.31678). Think of these bands like a rubber band around the price—when it stretches outside, it means something significant is happening. In this case, buyers are pushing hard.
Volume is speaking up: Notice those green bars getting taller at the bottom of the chart? That's trading volume picking up, especially in the last few days. When price rises and volume increases together, it usually means the move has legs.
The momentum meter is running hot: That yellow line at the very bottom is the RSI—it measures whether something is overbought or oversold. Right now it's at 86, which is extremely high. Anything above 70 suggests the asset might be due for a breather.
Why the Sudden Strength?
$SYRUP spent weeks consolidating (trading sideways) between $0.24 and $0.30. That built up pressure like a coiled spring. Now that it's broken above $0.30 with conviction, it's likely triggered what traders call a "breakout"—and possibly forced some traders who bet against it to exit their positions, adding fuel to the fire.
What to Watch Now
This is a tricky spot. The trend is clearly pointing up, but the momentum indicator suggests we're in overheated territory. Here's a sensible approach:
If you're considering entering: Wait for a pullback to around $0.30-$0.31. If the price dips back to test that level and holds, that's your confirmation that the breakout is real and buyers are still in control.
If you're already in: Consider taking some profits at these levels, or at least set a stop-loss below $0.30 to protect your gains.
The key level to watch: $0.30 is now the line in the sand. As long as SYRUP stays above it, the bulls are in charge. If it breaks back below, we might see another consolidation phase.
Bottom line: This looks promising, but patience beats panic. Let the chart come to you rather than chasing it at these heights.
Need help identifying specific entry and exit points based on your risk tolerance?
#SYRUP #maplefinanc #CryptoMarketWatch #AreYouBullishOrBearishToday? #AreYouBullishOrBearishToday?