【From Volatility to Reversal: Bitcoin's Next Major Rally Is About to Begin!】
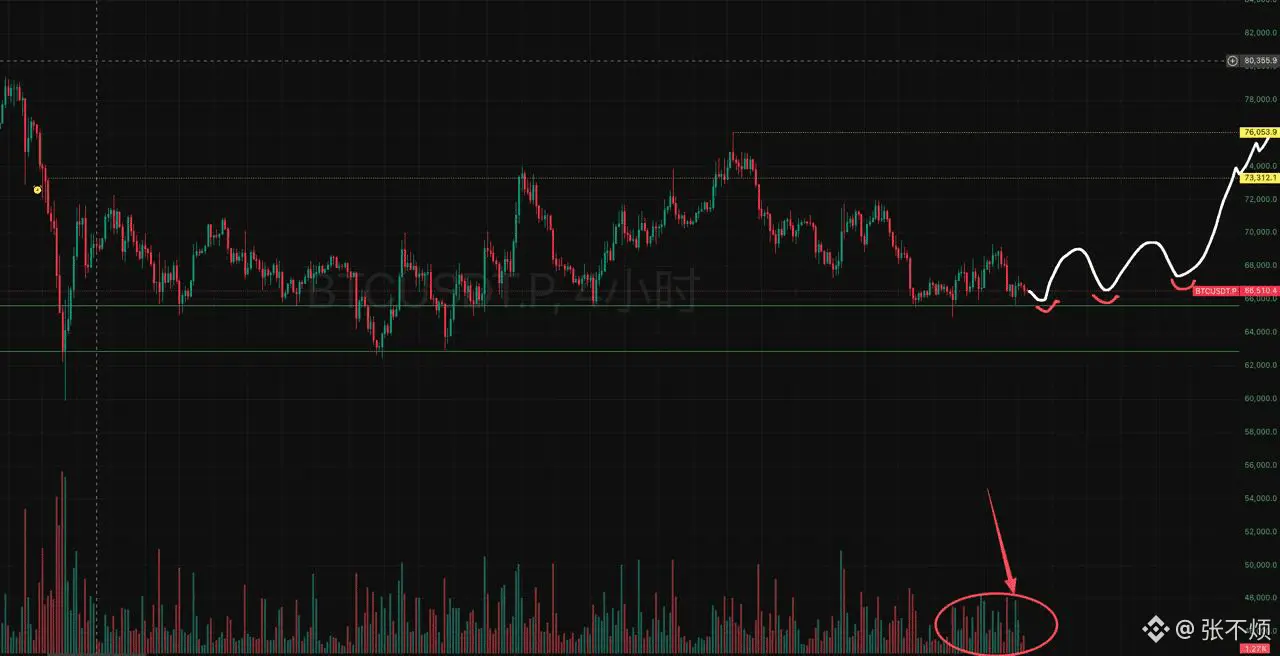
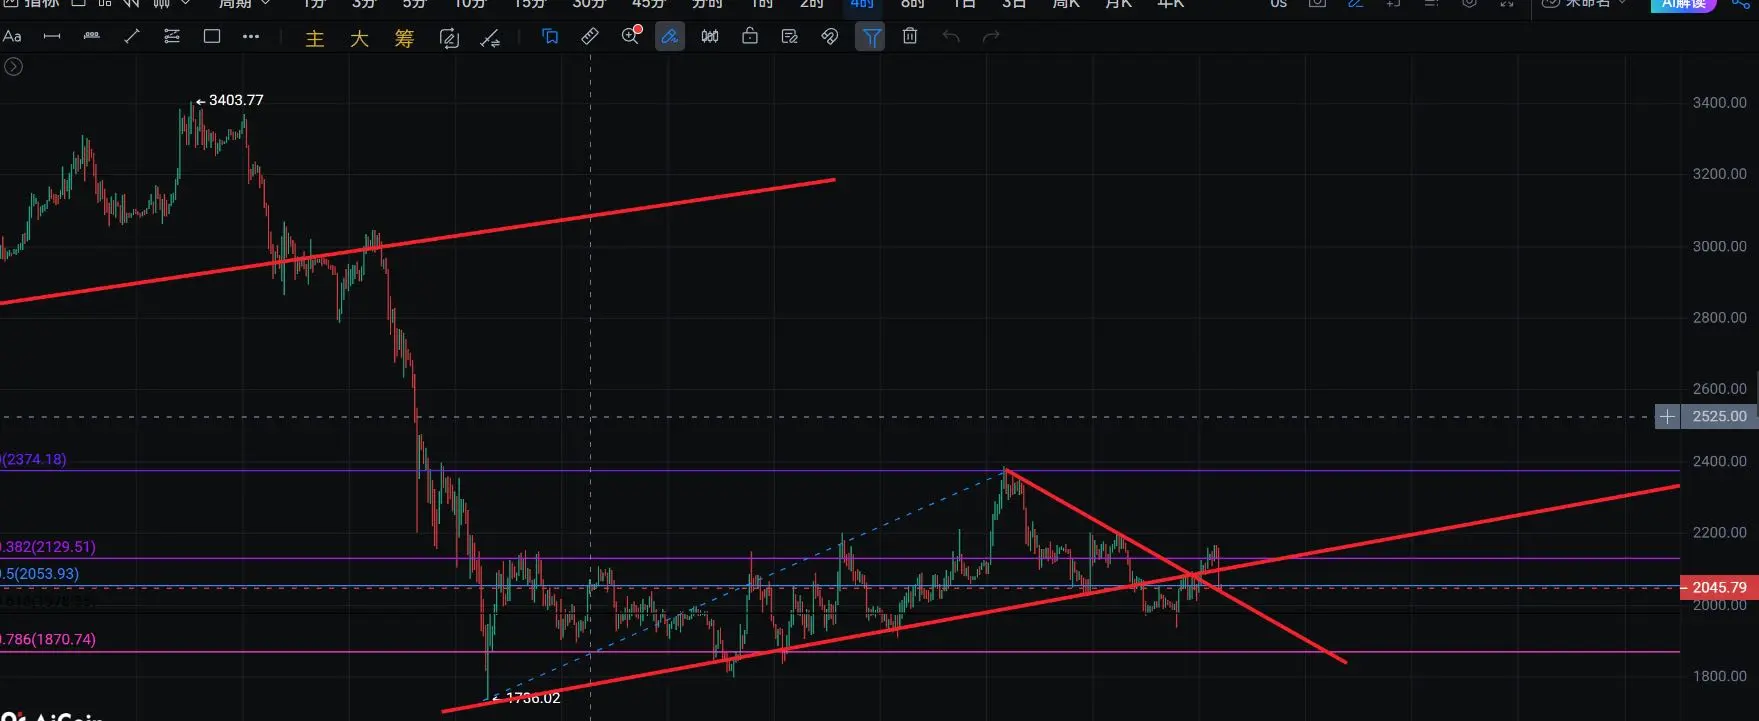
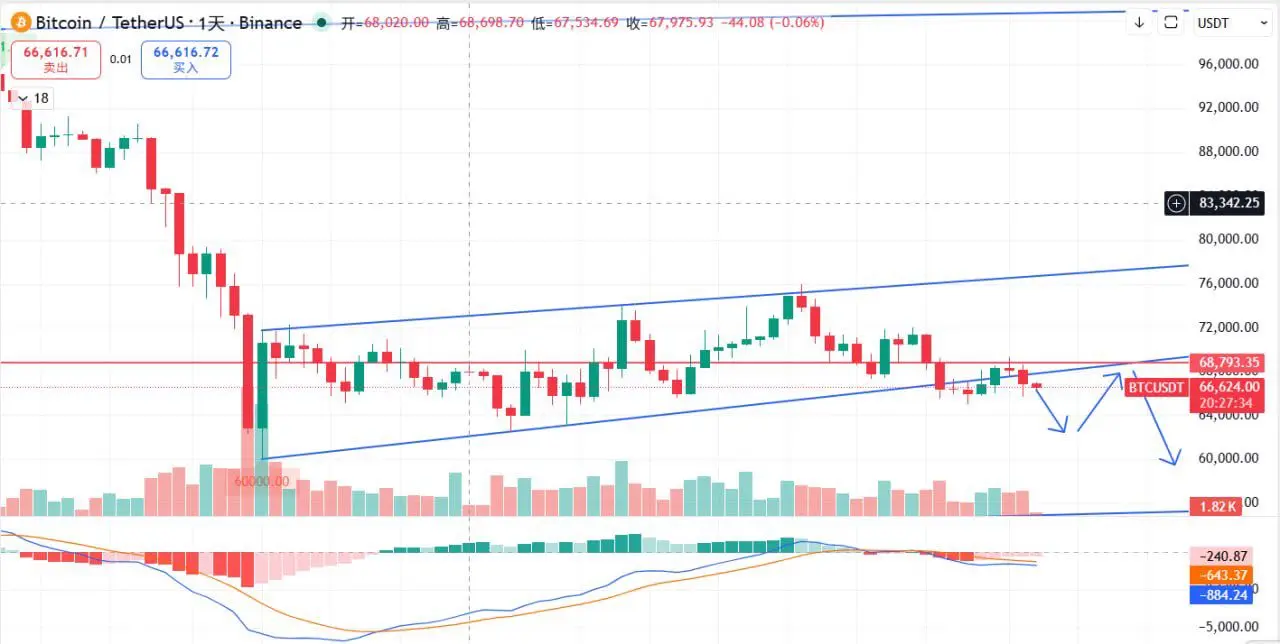
Since Bitcoin plummeted to 60,000, it has been trading within a flag pattern channel for the past two months. The price has been bouncing up and down within this structure, even reluctant to leave after breaking below it, indicating a liquidity crisis in the market.
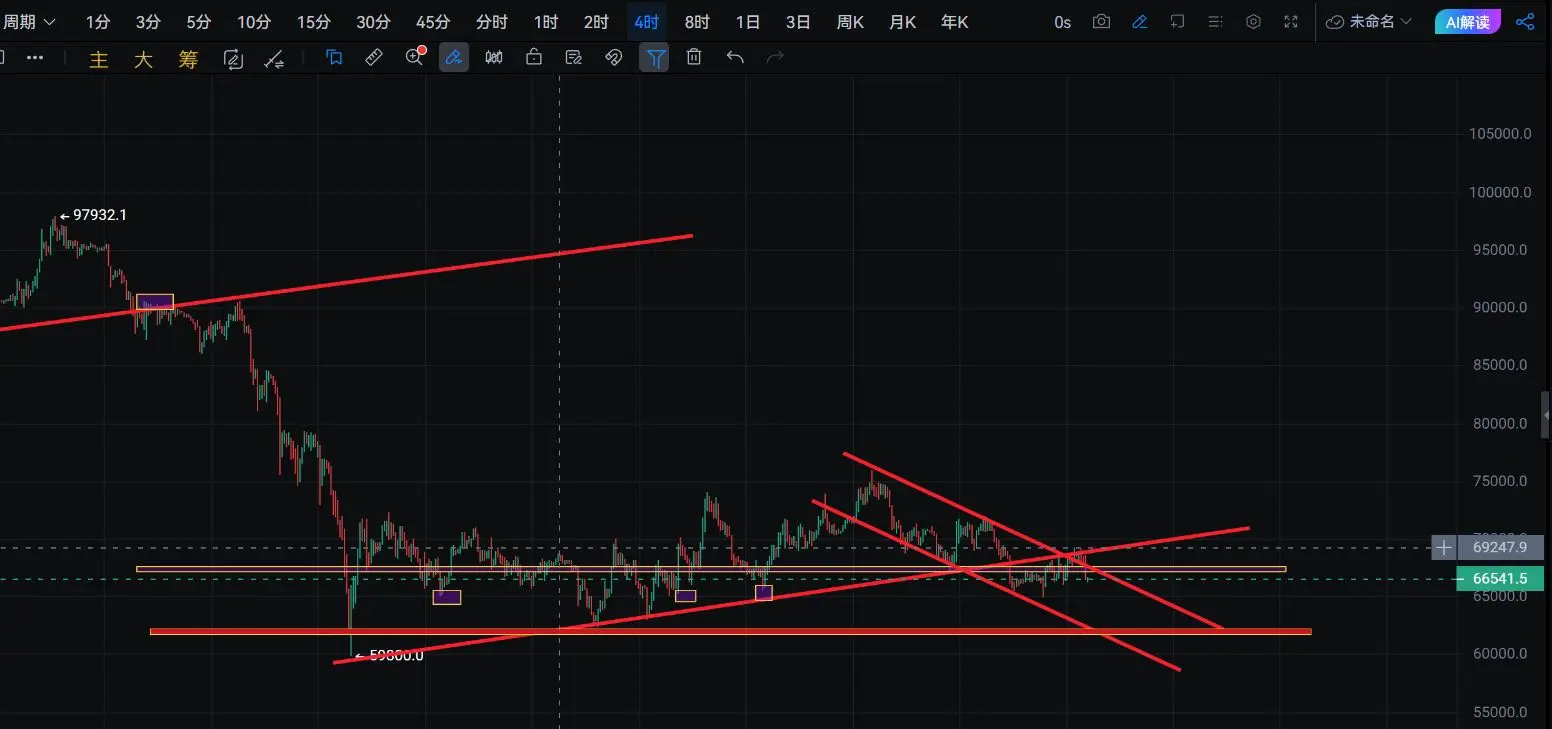
Recently, our market predictions have been very accurate. On the monthly chart, we forecasted that there would be no continued downtrend and that a bullish candle would form. On the weekly chart, we predicted a rebound near 75,000. In the short-term daily chart, we anticipated that after breaking the flag pattern, there wouldn't be an acceleration downward; instead, a consolidation and rebound would occur, and that the price wouldn't break back into the channel, possibly only poking above the trendline for up to three days. All these predictions have been validated, which can only be attributed to skill rather than luck!
Looking ahead, after the rebound, the market cycle suggests that the sideways movement won't last much longer. Currently, only the 4-hour chart's lower support is holding on, and no larger divergence has appeared.
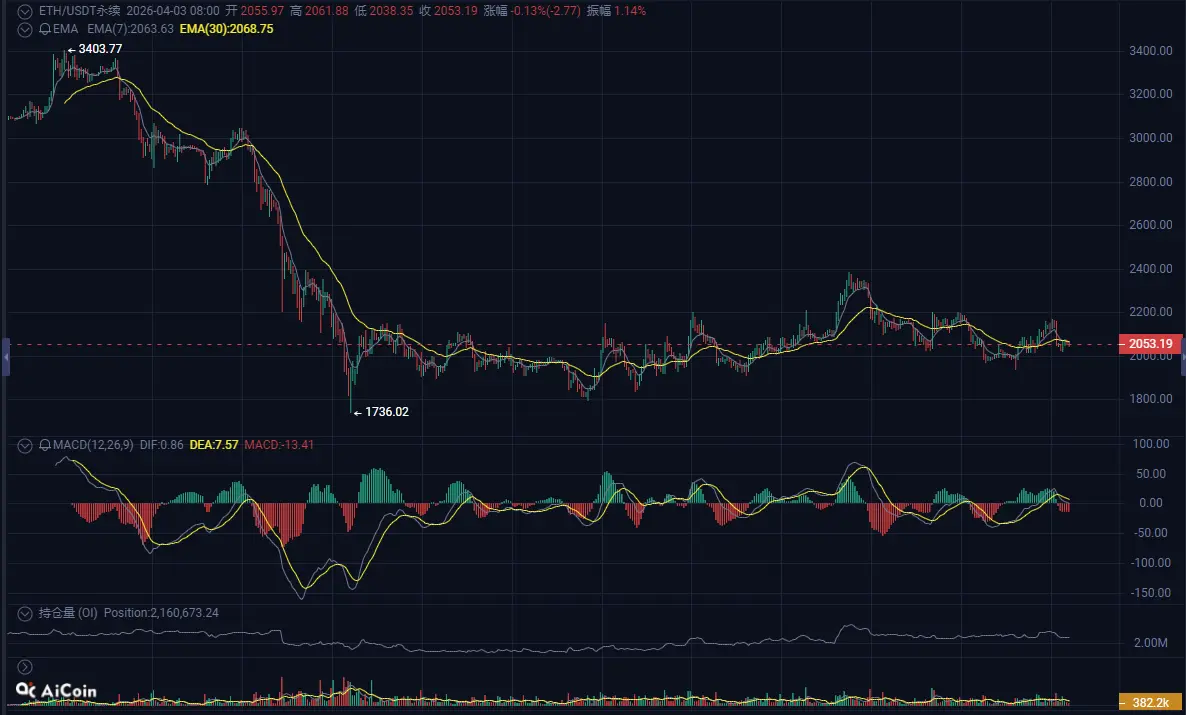
Today, Bitcoin continues to close below the lower boundary of the flag pattern. The MACD on the daily chart is beginning to extend downward. If the price continues to fall and breaks below the 65,000 support level, a decline toward around 63,000 could occur. After some consolidation there, a further breakdown could accelerate the downtrend. In that case, we should be looking for opportunities around 58,000.
Estimating the timing, the ongoing conflict might conclude in another week or two. After that, the U.S. will likely struggle to contain inflation, and ultimately, everyone will sit at the negotiation table, bargaining like merchants. The timing aligns with this scenario. If a chance below 58,000 or even lower appears, it would be a good opportunity to participate boldly.
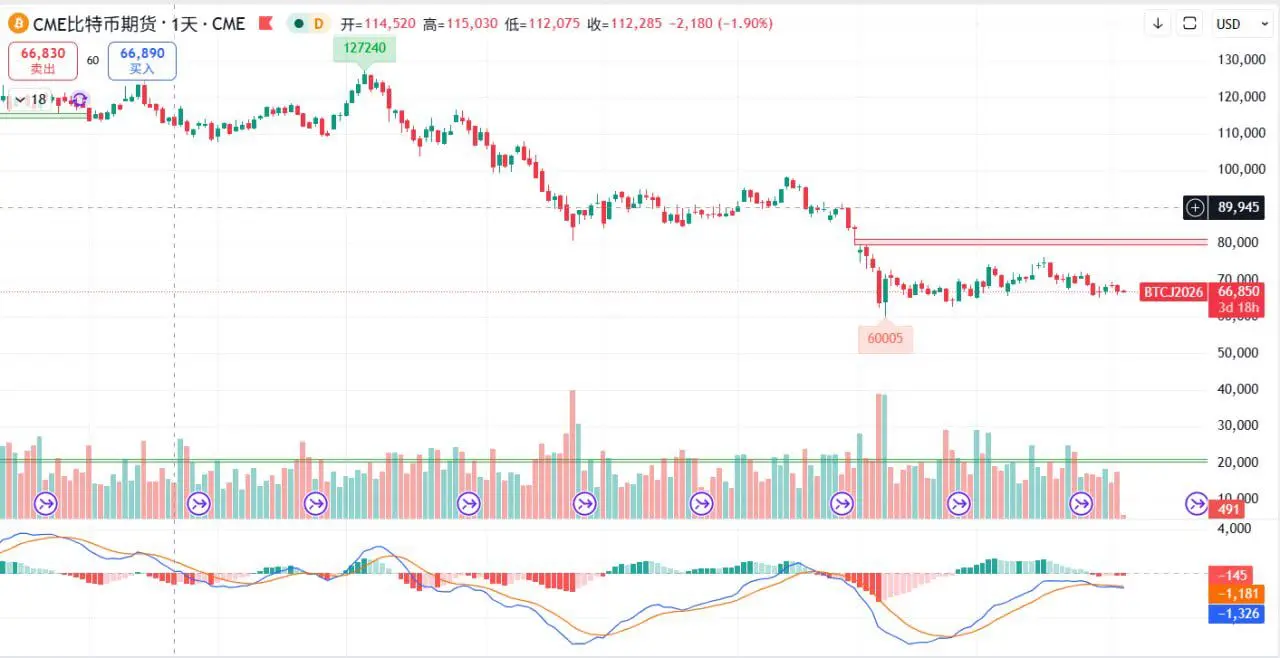
The rebound in this phase could be quite significant, initially targeting around 70,000, which is a minor resistance. If surpassed, the next target would be near 79,000. The ultimate goal might be to fill the CME's daily gap, around 82,000. This market movement is worth looking forward to!
#BTC走势分析 $BTC #ETH走势分析 $ETH
Since Bitcoin plummeted to 60,000, it has been trading within a flag pattern channel for the past two months. The price has been bouncing up and down within this structure, even reluctant to leave after breaking below it, indicating a liquidity crisis in the market.
Recently, our market predictions have been very accurate. On the monthly chart, we forecasted that there would be no continued downtrend and that a bullish candle would form. On the weekly chart, we predicted a rebound near 75,000. In the short-term daily chart, we anticipated that after breaking the flag pattern, there wouldn't be an acceleration downward; instead, a consolidation and rebound would occur, and that the price wouldn't break back into the channel, possibly only poking above the trendline for up to three days. All these predictions have been validated, which can only be attributed to skill rather than luck!
Looking ahead, after the rebound, the market cycle suggests that the sideways movement won't last much longer. Currently, only the 4-hour chart's lower support is holding on, and no larger divergence has appeared.
Today, Bitcoin continues to close below the lower boundary of the flag pattern. The MACD on the daily chart is beginning to extend downward. If the price continues to fall and breaks below the 65,000 support level, a decline toward around 63,000 could occur. After some consolidation there, a further breakdown could accelerate the downtrend. In that case, we should be looking for opportunities around 58,000.
Estimating the timing, the ongoing conflict might conclude in another week or two. After that, the U.S. will likely struggle to contain inflation, and ultimately, everyone will sit at the negotiation table, bargaining like merchants. The timing aligns with this scenario. If a chance below 58,000 or even lower appears, it would be a good opportunity to participate boldly.
The rebound in this phase could be quite significant, initially targeting around 70,000, which is a minor resistance. If surpassed, the next target would be near 79,000. The ultimate goal might be to fill the CME's daily gap, around 82,000. This market movement is worth looking forward to!
#BTC走势分析 $BTC #ETH走势分析 $ETH