On April 7, on-chain data platform Santiment released data showing that the ratio of profitable to losing trades for Bitcoin (BTC) over the past weekend reached 2.95:1, the highest level in the past 12 weeks, and is now approaching the 3.0 historical warning threshold that market analysts have long tracked. Santiment said that historical data shows that when the profitable trade ratio significantly outpaces the losing trade ratio, it is often an early signal of short-term price tops.
Indicator Mechanism with a Profit-to-Loss Ratio of 2.95: Profit-Taking Drives the Market
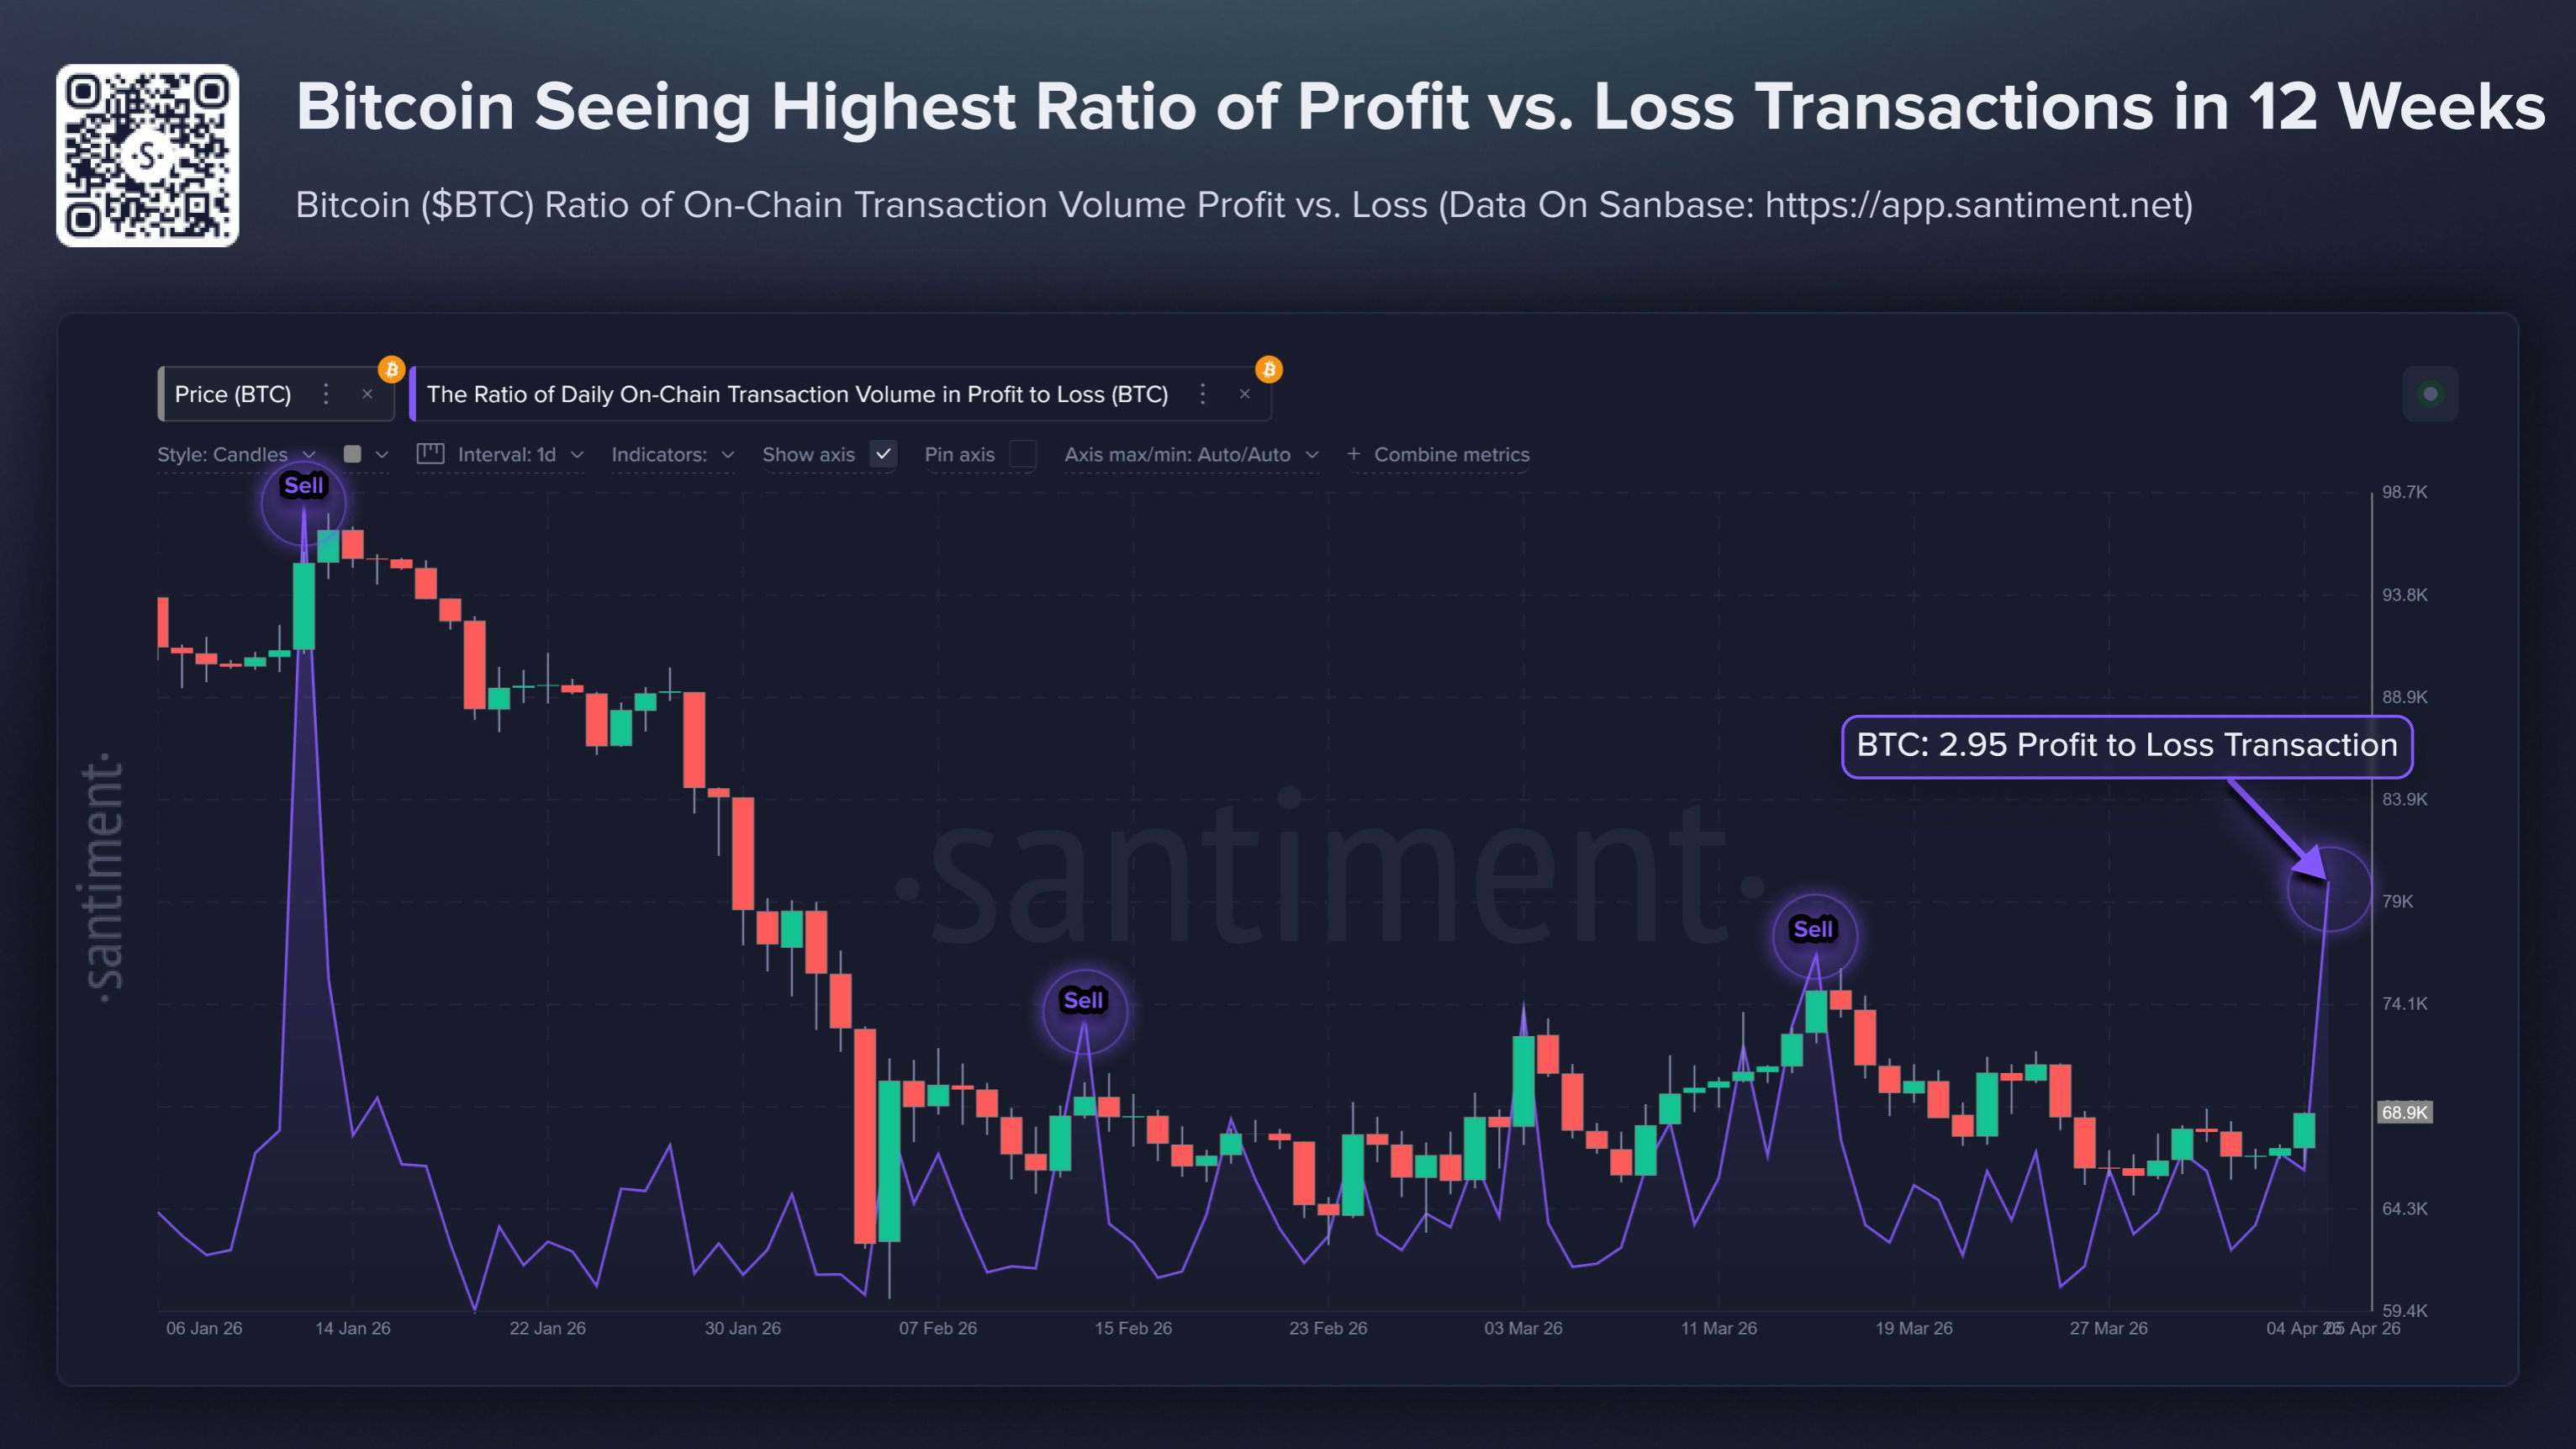 (Source: Santiment)
Santiment’s profit-to-loss ratio indicator works by tracking the movement path of each Bitcoin, comparing its current market price with the historical cost when the address was last transferred. If the current price is higher than the transfer cost, it is counted as a profitable trade; if it is lower, it is counted as a losing trade. A ratio of 2.95:1 today means that for every one losing trade, roughly three profit-taking events occur at about the same time.
This ratio has two layers of interpretation. On one hand, it reflects that the overall market is still in a profitable state, with sentiment leaning optimistic. On the other hand, it also suggests that potential selling pressure is building up. When a large portion of holdings is in unrealized gains, some investors’ motivations to realize profits tend to rise in sync, creating a downward suppression effect on short-term prices.
Historical Threshold of 3.0: Three Cases Reveal Patterns and Limitations
When Bitcoin’s profit-to-loss ratio approaches or exceeds 3.0, historical data shows a certain pattern of market reaction. The following three cases may be used as references:
April 2021 (3.2:1): Over the following 6 weeks, about 20% of short-term corrections appeared, a typical top formation
November 2021 (3.1:1): Appeared near Bitcoin’s historical high, followed by a bearish correction lasting up to a year
March 2024 (2.8:1): After a brief consolidation, the trend continued upward and did not form a clear top
The three cases show inconsistency— the March 2024 example indicates that a profit-to-loss ratio near 3.0 does not necessarily trigger a top. Behind it, macro conditions, the structure of institutional capital, and overall market momentum can all change the indicator’s final effectiveness—this is also the core reason analysts emphasize that the indicator should not be used in isolation.
Current Market Backdrop: A Composite Interpretation of Institutional Capital and Multi-Dimensional Indicators
Currently, the signal of a 2.95 profit-to-loss ratio appears within a more complex market structure. Exchange Bitcoin balances have recently generally declined, indicating that overall capital is leaning toward holding rather than selling, to some extent easing concerns about immediate selling pressure. At the same time, institutions are continuously increasing holdings of spot Bitcoin ETFs, changing the market behavior pattern traditionally dominated by retail investors. This enables a high profit-to-loss ratio to be maintained for a longer time without directly triggering a pullback.
Santiment and multiple market analysts suggest that the profit-to-loss ratio should be combined with the MVRV ratio, the number of active network addresses, miners’ behavior, and derivatives position data to form a more complete judgment of the market’s current situation. 2.95 is a warning signal worth ongoing tracking, but it is not an independent basis for buy or sell decisions.
Frequently Asked Questions
What is Santiment’s Bitcoin profit-to-loss trading ratio?
Santiment’s profit-to-loss trading ratio is calculated by comparing each Bitcoin’s current market price with its historical cost when it was last transferred from its address. It measures the ratio of the number of profitable trades to losing trades across the entire network. The higher the ratio, the greater the profit-taking pressure; below 1.0 indicates losing trades dominate, which historically has often been a leading signal of buying opportunities.
Does a BTC profit-to-loss ratio of 2.95 require immediate action?
Santiment’s historical data shows that periods with high profit-to-loss ratios are often associated with short-term price tops, but this is not inevitable. When the ratio reached 2.8 in March 2024, the market ultimately continued to move upward. Analysts recommend combining this indicator with the MVRV ratio, exchange net flows, and derivatives data, rather than using it alone as an action signal.
When does the profit-to-loss ratio form a buy signal?
Santiment points out that when the number of losing trades exceeds the number of profitable trades—meaning the ratio remains consistently low—historically it is often a favorable time for “smart money” positioning. This reflects pessimistic market sentiment, with coin supply being sold in a panic manner, and provides relatively undervalued entry conditions for long-term allocators.
Disclaimer: The information on this page may come from third parties and does not represent the views or opinions of Gate. The content displayed on this page is for reference only and does not constitute any financial, investment, or legal advice. Gate does not guarantee the accuracy or completeness of the information and shall not be liable for any losses arising from the use of this information. Virtual asset investments carry high risks and are subject to significant price volatility. You may lose all of your invested principal. Please fully understand the relevant risks and make prudent decisions based on your own financial situation and risk tolerance. For details, please refer to
Disclaimer.
