


#WarshSaysFedDecidesIfAIInflation
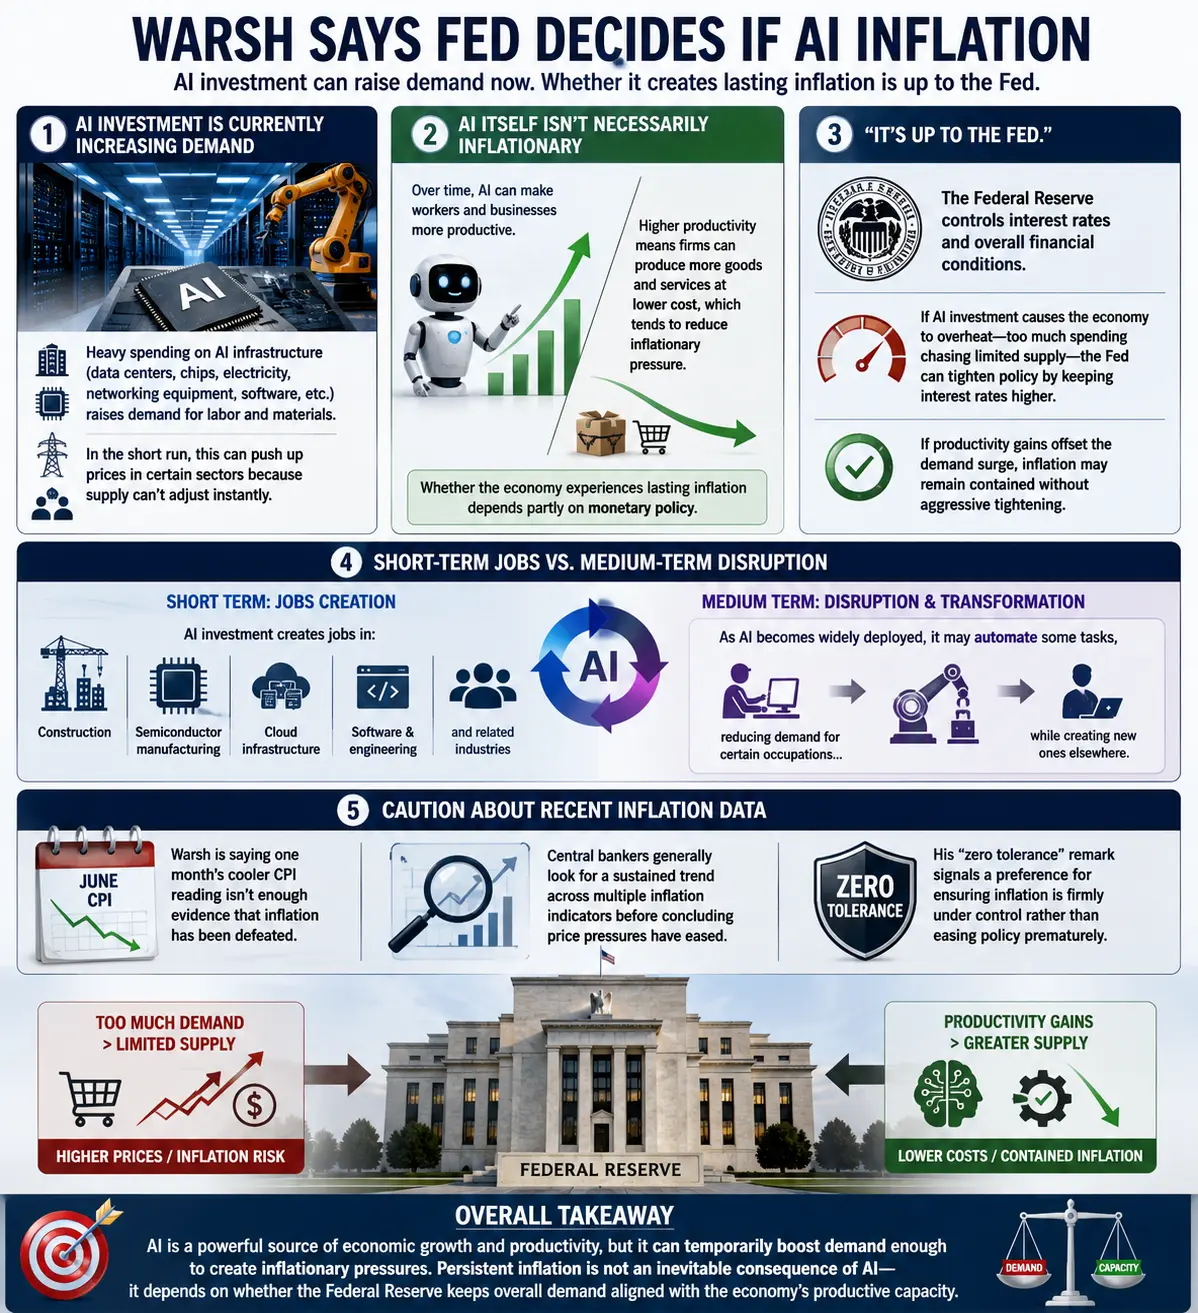
AI investment is currently increasing demand.
Heavy spending on AI infrastructure (data centers, chips, electricity, networking equipment, software, etc.) raises demand for labor and materials.
In the short run, this can push up prices in certain sectors because supply can't adjust instantly.
AI itself isn't necessarily inflationary.
Over time, AI can make workers and businesses more productive.
Higher productivity means firms can produce more goods and services at lower cost, which tends to reduce inflationary pressure.
Whether the economy experiences lasting inflation depends partly on monetary policy.
"It's up to the Fed."
The Federal Reserve controls interest rates and overall financial conditions.
If AI investment causes the economy to overheat—too much spending chasing limited supply—the Fed can tighten policy by keeping interest rates higher.
If productivity gains offset the demand surge, inflation may remain contained without aggressive tightening.
Short-term jobs vs. medium-term disruption.
Short term: AI investment creates jobs in construction, semiconductor manufacturing, cloud infrastructure, software, and related industries.
Medium term: As AI becomes widely deployed, it may automate some tasks, reducing demand for certain occupations while creating new ones elsewhere.
Caution about recent inflation data.
Warsh is saying one month's cooler CPI reading isn't enough evidence that inflation has been defeated.
Central bankers generally look for a sustained trend across multiple inflation indicators before concluding price pressures have eased.
His "zero tolerance" remark signals a preference for ensuring inflation is firmly under control rather than easing policy prematurely.
Overall takeaway
The underlying message is that AI is viewed as a powerful source of economic growth and productivity, but it can temporarily boost demand enough to create inflationary pressures. In this view, persistent inflation is not an inevitable consequence of AI—it depends on whether the Federal Reserve keeps overall demand aligned with the economy's productive capacity.