WhyFay

vip
Peak Tier 0
Diamond Hands
Crypto Market Researcher
I'm back
Gate Alpha Hot Tokens Competition Phase 48 is Live!
🎁 Total prize pool reaches $40,000, maximum 15.15 GT per draw✨
🔥 Eligible Tokens: $manlet, $FABLE, $ANSEM and $quq
🎯 Standard Mystery Box | Prize Pool: $20,000
▪️Users signing up without referral codes: Hit 200 USDT trading volume for 1 raffle chance
▪️Min reward: 0.18 GT per draw, capped at 7.58 GT max
💵 Premium Mystery Box | Prize Pool: $20,000
▪️Users signing up via referral codes: Hit 500 USDT trading volume for 1 raffle chance
▪️Min reward: 0.38 GT per draw, capped at 15.15 GT max
⏰ Event Time: July 6 02:00 – July 9 08:00 (UTC)
👉 Jo
GT0.88%
Gate_Square
Gate Alpha Hot Tokens Competition Phase 48 is Live!
🎁 Total prize pool reaches $40,000, maximum 15.15 GT per draw✨
🔥 Eligible Tokens: $manlet, $FABLE, $ANSEM and $quq
🎯 Standard Mystery Box | Prize Pool: $20,000
▪️Users signing up without referral codes: Hit 200 USDT trading volume for 1 raffle chance
▪️Min reward: 0.18 GT per draw, capped at 7.58 GT max
💵 Premium Mystery Box | Prize Pool: $20,000
▪️Users signing up via referral codes: Hit 500 USDT trading volume for 1 raffle chance
▪️Min reward: 0.38 GT per draw, capped at 15.15 GT max
⏰ Event Time: July 6 02:00 – July 9 08:00 (UTC)
👉 Join Now: https://www.gate.com/campaigns/5407Alpha?pid=TG&ch=424zUpmF
👉 Details: https://www.gate.com/announcements/article/100502
#GateAlpha #HotTokens #GateAlphaPoints
repost-content-media
  • Reward
  • Comment
  • Repost
  • Share
#GTBurns2.57MInQ2
Q2 2026 GT Burn: Six Years of Consistent Tokenomics Strengthening Long-Term Ecosystem Value
A Milestone That Reflects Discipline Rather Than Hype
July 2026 marks another significant milestone in the evolution of the GT ecosystem with the successful execution of the official Q2 2026 GT burn. A total of 2,570,063 GT, valued at more than $17.75 million, has been permanently transferred to the burn address, making these tokens unrecoverable and permanently removing them from circulation.
While individual token burns often attract temporary market attention, the real story behind
Yusfirah
#GTBurns2.57MInQ2
Q2 2026 GT Burn: Six Years of Consistent Tokenomics Strengthening Long-Term Ecosystem Value
A Milestone That Reflects Discipline Rather Than Hype
July 2026 marks another significant milestone in the evolution of the GT ecosystem with the successful execution of the official Q2 2026 GT burn. A total of 2,570,063 GT, valued at more than $17.75 million, has been permanently transferred to the burn address, making these tokens unrecoverable and permanently removing them from circulation.
While individual token burns often attract temporary market attention, the real story behind this event is far more meaningful. The latest burn represents another chapter in a commitment that has continued consistently since 2019. In an industry where many projects frequently revise tokenomics or change long-term strategies, maintaining a transparent and uninterrupted burn program for six consecutive years demonstrates strategic discipline and a long-term vision focused on sustainable ecosystem growth.
The importance of tokenomics extends well beyond short-term price movements. Healthy digital asset ecosystems rely on balanced supply management, transparent governance, sustainable utility, and continuous ecosystem development. The Q2 2026 GT burn reinforces these principles while highlighting how predictable token management can contribute to stronger market confidence over time.
Official Q2 2026 Burn Update
The latest quarterly burn permanently removed 2,570,063 GT from circulation, representing a value exceeding $17.75 million at the time of execution.
This burn continues a long-standing deflationary mechanism designed to gradually reduce the available supply of GT while supporting the long-term health of the ecosystem.
Since the launch of GT in 2019, nearly 190 million GT has been permanently burned. This has reduced the original maximum supply of 300 million GT by approximately 63.32%, with the cumulative value of all burned tokens now exceeding $1.31 billion.
These figures highlight one of the most substantial long-term token reduction programs within the digital asset industry. More importantly, they demonstrate consistency rather than isolated promotional activity.
Why Long-Term Tokenomics Matters
Tokenomics forms the economic foundation of every blockchain ecosystem. Regardless of technological innovation, sustainable token economies require carefully managed issuance, distribution, incentives, and supply reduction mechanisms.
When token supply grows without corresponding demand or utility, dilution can reduce long-term confidence. Conversely, a structured and transparent reduction strategy can help balance ecosystem growth while encouraging sustainable participation.
The GT burn mechanism reflects a disciplined approach to supply management rather than reactive market intervention. Quarterly burns establish predictable expectations for the community while reinforcing confidence that the economic model continues operating according to its long-term framework.
Consistency is often more valuable than size. Markets generally respond more positively to predictable execution than occasional large events lacking continuity.
Transparency Through On-Chain Verification
One of blockchain technology's greatest strengths is transparency.
Every GT burn transaction is permanently recorded on-chain, allowing anyone to independently verify that the burned tokens have been transferred to the designated burn address and permanently removed from circulation.
Unlike traditional financial systems that often require trust in internal reporting, blockchain enables mathematical verification through publicly accessible transaction records.
This transparency strengthens confidence because ecosystem participants do not need to rely solely on announcements. Instead, they can independently confirm every transaction, ensuring accountability throughout the burn process.
As blockchain adoption continues expanding globally, transparent verification mechanisms like these will likely become increasingly important standards for responsible digital asset management.
Six Consecutive Years of Execution Demonstrate Long-Term Commitment
Perhaps the most impressive aspect of the Q2 2026 burn is not the dollar value but the consistency behind it.
Maintaining quarterly burns for six consecutive years requires long-term planning, disciplined execution, and continued adherence to publicly communicated tokenomics.
Many blockchain initiatives begin with ambitious economic models but later modify or abandon their original frameworks due to changing market conditions. Consistency across multiple market cycles demonstrates organizational maturity and strategic confidence.
This sustained execution signals that ecosystem development is focused on long-term sustainability rather than short-term attention.
The latest burn therefore represents more than another quarterly event—it reinforces a history of reliable execution.
Scarcity and Market Psychology
Reducing circulating supply does not automatically guarantee higher prices. Market performance remains influenced by adoption, liquidity, macroeconomic conditions, user activity, technological innovation, and overall investor sentiment.
However, decreasing supply can contribute to scarcity when accompanied by expanding ecosystem participation and growing utility.
Scarcity influences market psychology by encouraging investors to evaluate long-term availability alongside demand dynamics.
As more tokens are permanently removed from circulation, each remaining token represents a larger proportional share of the overall supply.
When this process occurs consistently within an expanding ecosystem, scarcity becomes one component supporting stronger long-term valuation models.
Nevertheless, sustainable appreciation depends on continued ecosystem growth rather than supply reduction alone.
The Role of GT Within the Ecosystem
GT serves as an important component of the broader ecosystem by supporting multiple functions that contribute to platform participation and community engagement.
A token derives lasting value primarily from utility rather than speculation.
Strong ecosystems encourage continuous usage through practical applications that integrate the token into everyday platform activity.
When disciplined tokenomics combine with expanding utility, the resulting economic model becomes more resilient across changing market environments.
This balance between functionality and responsible supply management helps strengthen long-term confidence among participants who prioritize sustainable ecosystem development.
Balanced Market Perspective
The Q2 2026 burn represents a fundamentally positive development for the GT ecosystem, yet responsible analysis requires acknowledging both opportunities and uncertainties.
On the positive side, continued supply reduction reinforces disciplined tokenomics, strengthens transparency, demonstrates long-term commitment, and contributes to scarcity over time.
At the same time, broader market performance will continue depending on multiple external factors, including global economic conditions, cryptocurrency market sentiment, regulatory developments, technological innovation, and ongoing ecosystem adoption.
No burn event alone determines future market prices.
Instead, token burns should be viewed as one important component within a much broader framework that includes utility, community growth, infrastructure expansion, and sustained user participation.
Long-term investors often evaluate all these variables collectively rather than focusing on a single event.
My Perspective
From my perspective, the most valuable aspect of the Q2 2026 GT burn is not simply the millions of dollars removed from circulation but the consistency and transparency demonstrated over six years.
Blockchain technology was built around the principles of openness, accountability, and verifiable execution. When tokenomics are implemented exactly as communicated—and every transaction can be independently verified on-chain—it strengthens trust across the ecosystem.
Sustainable blockchain projects are rarely defined by short-term headlines. They are built through disciplined execution repeated quarter after quarter, year after year.
The latest burn reflects exactly that philosophy.
As the digital asset industry continues maturing, I believe projects emphasizing transparent governance, responsible supply management, and long-term ecosystem development will be better positioned to earn lasting confidence from both existing participants and future adopters.
Conclusion
The official Q2 2026 GT burn represents far more than the destruction of 2,570,063 GT worth over $17.75 million. It represents six consecutive years of disciplined execution, transparent blockchain verification, and commitment to sustainable tokenomics.
With nearly 190 million GT permanently removed since 2019, approximately 63.32% of the original 300 million supply eliminated, and cumulative burns exceeding $1.31 billion, the program demonstrates one of the industry's most consistent long-term supply management strategies.
While no single event can determine future market direction, transparent tokenomics, verifiable on-chain execution, and sustained ecosystem development create a stronger foundation for long-term confidence.
As blockchain continues evolving, projects that combine real utility with accountable economic design are likely to remain among the strongest examples of sustainable digital asset ecosystems. The Q2 2026 GT burn is another reminder that long-term value is built through consistency, transparency, and disciplined execution rather than short-lived market excitement.
@Gate_Square
repost-content-media
  • Reward
  • Comment
  • Repost
  • Share
#GateRewardsHubBonus — Discover Every Reward Opportunity Inside Gate
Maximizing rewards on a cryptocurrency exchange requires more than simply completing trades. Understanding available campaigns, eligibility requirements, and promotional opportunities allows users to unlock significantly greater value from their overall platform experience.
Gate simplifies this process through the Rewards Hub, a centralized destination that gathers campaigns across Spot Trading, Futures, Earn, Quant Fund, Gate Learn, and many other ecosystem products into one convenient interface.
Explore Ongoing Campaigns
Th
USDC-0.01%
Falcon_Official
#GateRewardsHubBonus — Discover Every Reward Opportunity Inside Gate
Maximizing rewards on a cryptocurrency exchange requires more than simply completing trades. Understanding available campaigns, eligibility requirements, and promotional opportunities allows users to unlock significantly greater value from their overall platform experience.
Gate simplifies this process through the Rewards Hub, a centralized destination that gathers campaigns across Spot Trading, Futures, Earn, Quant Fund, Gate Learn, and many other ecosystem products into one convenient interface.
Explore Ongoing Campaigns
The Rewards Hub organizes promotions into Ongoing and Ended categories, making it easy to discover active opportunities while reviewing previous campaigns for future reference.
Each listing clearly explains eligibility requirements and reward details before participation, allowing users to understand exactly what is required before joining.
The Join Now option provides immediate access to campaigns that match a user's profile, creating a smooth experience from discovery to participation.
Multiple Ways to Earn
Gate offers a wide variety of reward types designed for different trading activities and experience levels.
Available rewards include:
Futures Trading Fee Rebate Vouchers
Position Experience Vouchers
Platform Reward Points
Cryptocurrency Red Packets
Trading fee rebate vouchers reduce futures trading costs, while Position Experience Vouchers allow users to explore leveraged trading without risking personal funds.
Reward Points can be used for additional platform benefits, while Red Packets deliver real crypto assets directly to eligible participants.
The Red Packet System
One of Gate's most engaging community features is the Red Packet system.
Users can create password-protected red packets using supported tokens from their account balances, with total distributions ranging from 1 USDT to 10,000 USDT and allocations shared among 2 to 10,000 recipients.
Custom passwords, personalized messages, random password generation, and new-user restrictions make red packets both a rewarding social feature and an effective community growth tool.
Claim Your Position Experience Vouchers
Many campaigns reward participants with Position Experience Vouchers.
After meeting event requirements, these vouchers become available through the Coupon Center, where users can activate and manage them.
Checking the Coupon Center regularly ensures valuable rewards are never overlooked after completing campaign participation.
Referral Benefits
Gate also extends rewards through its referral system.
New users who register using referral codes receive permanent trading fee discounts across Spot, Futures, and Margin markets while unlocking welcome rewards worth more than 10,000 USDC by completing beginner tasks inside the Rewards Hub within the required timeframe.
This creates a win-win ecosystem where existing users, new members, and the platform all benefit together.
Don't Miss Time-Limited Campaigns
Many of Gate's promotional opportunities are available only during specific periods.
For example, the Gate Chat Product Feedback Campaign, running from July 2 to July 17, 2026, rewards eligible participants with both participation prizes and Outstanding Suggestion Awards.
Joining campaigns early increases the chances of maximizing available rewards before promotional windows close.
Unlock the Full Gate Ecosystem
Gate's reward system is designed as a connected ecosystem rather than a collection of separate promotions.
A new user may begin with referral rewards, continue through Rewards Hub campaigns, participate in Gate Chat red packet events, receive Position Experience Vouchers, explore futures trading, and eventually contribute product feedback that helps shape future platform development.
Each activity builds upon the previous one, creating a rewarding journey for both beginners and experienced traders alike.
By exploring the Rewards Hub regularly, activating vouchers through the Coupon Center, participating in ongoing campaigns, and taking advantage of time-limited opportunities, users can unlock the full value of everything Gate has to offer.
@Gate_Square
repost-content-media
  • Reward
  • Comment
  • Repost
  • Share
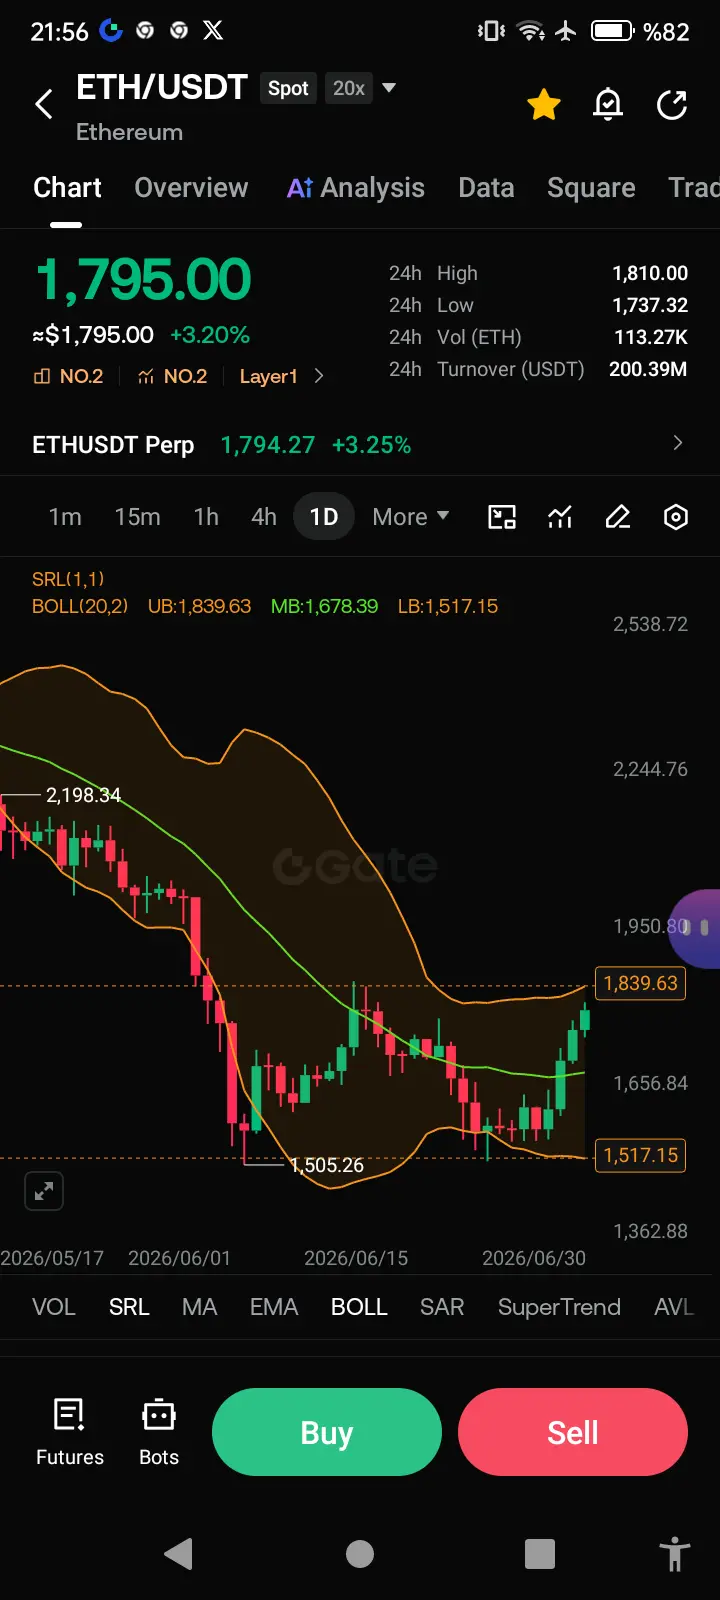
$ETH
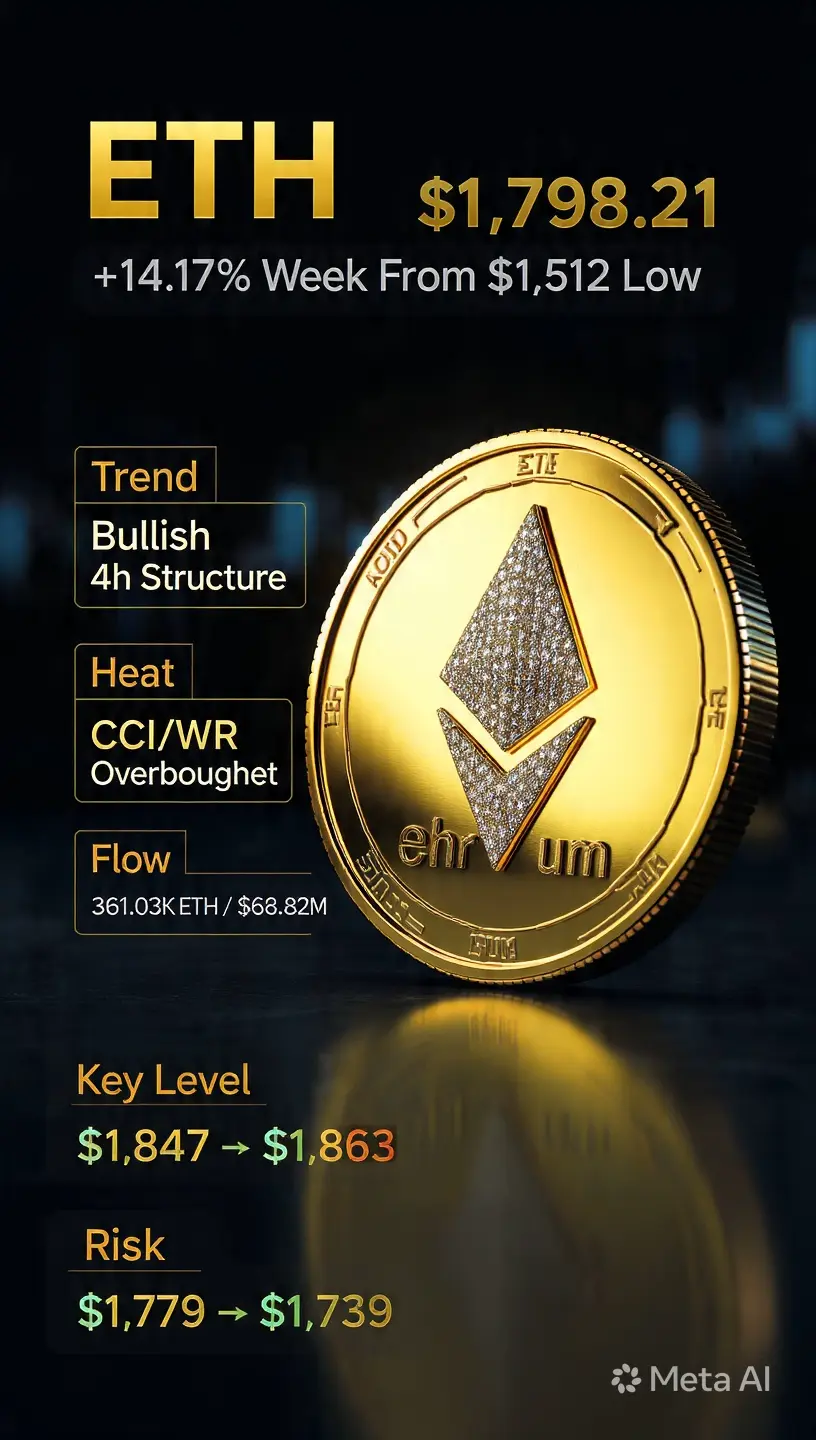
ETH $1,798.21: +14.15% Week From $1,512 Low. $1,807 Break Next, or Pullback to $1,779?
Quick Look
ETH is at $1,798.21, up 0.93% today. 24h range: $1,729.02 to $1,807.84. Flow hit 361.03K ETH / $636.82M. After tagging $1,512.11, ETH ran 19.5% to current levels. Trend is up, but short-term gauges are hot.
What The Chart Says: Bullish Structure Meets Overheat
1. 4h Trend Is Clean: MA5 $1,779.73, MA10 $1,777.02, MA30 $1,739.38 are stacked and rising. MA7 > MA30 > MA120 on the 4h confirms a bull setup. Price holds above all three. PDI > MDI with high ADX on 15m and 4h also shows buyers in c
ETH0.19%
BTC0.34%
Venüs_
$ETH
ETH $1,798.21: +14.15% Week From $1,512 Low. $1,807 Break Next, or Pullback to $1,779?
Quick Look
ETH is at $1,798.21, up 0.93% today. 24h range: $1,729.02 to $1,807.84. Flow hit 361.03K ETH / $636.82M. After tagging $1,512.11, ETH ran 19.5% to current levels. Trend is up, but short-term gauges are hot.
What The Chart Says: Bullish Structure Meets Overheat
1. 4h Trend Is Clean: MA5 $1,779.73, MA10 $1,777.02, MA30 $1,739.38 are stacked and rising. MA7 > MA30 > MA120 on the 4h confirms a bull setup. Price holds above all three. PDI > MDI with high ADX on 15m and 4h also shows buyers in control. 2. Short-Term Too Hot: 4h and daily CCI + WR sit in the high zone. That means overbought. Price went from $1,729 to $1,807 in 24h and paused right at the wall. After 14.15% in 7 days, profit-taking risk rises. 3. Daily Gives A Contrarian Bull Case: Daily MACD and RSI show bullish splits. Price made a lower low at $1,512, but MACD and RSI made higher lows. That’s a bottom signal. It means the drop to $1,512 lost force, and the path of least push is up.
Flow And BTC Context
Flow expanded with price. $636.82M in 24h is solid and backs the move. Still, ETH underperformed BTC by 0.85% this week. If BTC keeps leading, ETH tends to lag then play catch-up once $1,800 breaks clean.
Key Levels
The gate is $1,807.84, the 24h high. Above it sits $1,849.41, then $1,883.13 and the June high near $1,950.
If Bulls Win: A 4h close over $1,808 opens $1,849 → $1,883 → $1,950. Break $1,883 and the move from $1,512 targets $2,000 round level.
If Bears Step In: Lose $1,798 and MA5 $1,779.73 is first hold. Below that, $1,777.02 MA10 and $1,781.94 zone line up. Break $1,739.38 MA30 and $1,729 24h low gets tested. That would be a 4% dip but still hold the 4h up trend.
MACD Detail
4h MACD is -3.97, but DIF 28.40 is about to cross DEA 32.37 from below. Histogram bars are shrinking on the downside. A cross up in the low zone often leads to a fast leg up. If it triggers, $1,849 comes quick.
Game Plan
Aggressive: $1,779 – $1,777 zone is ideal for bids. Stop under $1,770. Target $1,807, then $1,849.
Safe: Wait for a 1h close above $1,810 with rising flow. Then aim for $1,849 and $1,883.
Risk Off: If MA30 $1,739 breaks, step aside. Next solid buy zone is $1,729 to $1,680.
Bottom Line: ETH flipped trend from $1,512 and holds a clean 4h bull structure. Flow supports the move and daily splits point up. But CCI and WR are high on 4h/daily. Break $1,807 and $1,883 is open. Reject it, and $1,779 to $1,739 is the first dip zone.
Did you catch ETH at $1,512 or are you waiting for $1,810 to break? What’s your level? Drop it below.
$ETH ‌ #Ethereum #ETH #Crypto
repost-content-media
  • Reward
  • Comment
  • 1
  • Share
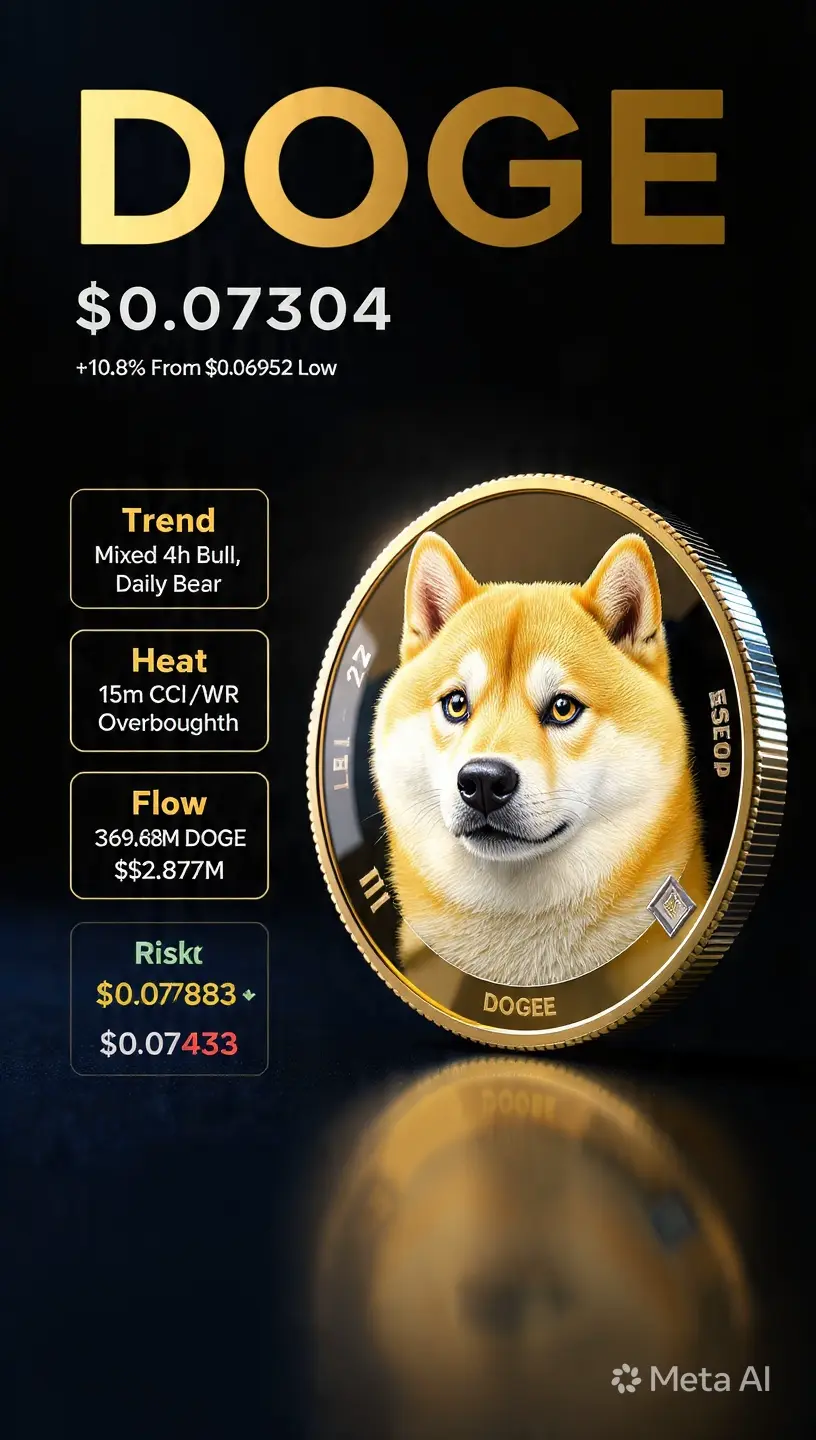
$DOGE ‌DOGE $0.07704: +10.8% From $0.06952 Low But Stalls at $0.07883. Daily Still Bearish?
Quick Look
DOGE is at $0.07704, down 0.27% today. 24h range: $0.07439 to $0.07883. Flow hit 369.68M DOGE / $28.38M. Up 6.88% in 7 days after bouncing from $0.06952. Short-term tries to push up, but the bigger frame says caution.
What The Chart Says: Mixed Signals, Weak Flow
1. 4h Tries To Flip Bullish: MA5 $0.07688, MA10 $0.07688, MA30 $0.07610 are flat and tight. Price sits just above them. 4h SAR flipped bullish and 15m shows PDI > MDI, so short-term buyers are active. 2. Daily Structure Still Hea
DOGE-2.20%
Venüs_
$DOGE ‌DOGE $0.07704: +10.8% From $0.06952 Low But Stalls at $0.07883. Daily Still Bearish?
Quick Look
DOGE is at $0.07704, down 0.27% today. 24h range: $0.07439 to $0.07883. Flow hit 369.68M DOGE / $28.38M. Up 6.88% in 7 days after bouncing from $0.06952. Short-term tries to push up, but the bigger frame says caution.
What The Chart Says: Mixed Signals, Weak Flow
1. 4h Tries To Flip Bullish: MA5 $0.07688, MA10 $0.07688, MA30 $0.07610 are flat and tight. Price sits just above them. 4h SAR flipped bullish and 15m shows PDI > MDI, so short-term buyers are active. 2. Daily Structure Still Heavy: Daily remains bearish with MA7 < MA30 < MA120. That alignment keeps the main trend down until it breaks. DOGE topped at $0.09247 and slid to $0.06952. This move is a relief rally inside a downtrend. 3. Overheat On Lighter Timeframes: 15m CCI and WR are in the high zone. That flags short-term overbought after the run from $0.07439 to $0.07883. Price stalled right at $0.07883 and pulled back. 4. Flow Is Drying Up: 24h flow is 369.68M, under the 7-day average. Price bounced 6.88% on the week but on falling flow. That’s a “pullback on less flow” setup. Rallies like this often fade without new bids.
Daily Hope: Bullish Split Forming
Daily MACD shows a bottom split. Price made a lower low at $0.06952, but MACD did not. Same for RSI. That means sell pressure is losing force. If daily MA7 starts turning up, the bigger trend can shift.
Key Levels
The wall is $0.07883, the 24h high. Above it sits $0.08099, then $0.08787 and $0.09247 June peak.
If Bulls Win: A 4h close above $0.07890 opens $0.08099 → $0.08787 → $0.09247. Break $0.09247 and the daily downtrend breaks.
If Bears Step In: Lose $0.07704 and MA5/MA10 $0.07688 is first test. Under that, $0.07610 MA30 and $0.07439 24h low line up. Break $0.07439 and $0.06952 low comes fast. That would be a 9.7% drop and keep daily bearish.
MACD Detail
4h MACD is -0.00016, with DIF 0.00052 under DEA 0.00069. Lines are close to a cross up but haven’t confirmed. Histogram is flat. No clear force yet. Needs a push over $0.07800 with flow to turn up.
Game Plan
Aggressive: Buy dips to $0.07688 MA5/MA10 zone. Stop under $0.07600. Target $0.07883, then $0.08099.
Safe: Wait for a 1h close above $0.07900 with rising flow. Then aim for $0.08099 and $0.08787.
Risk Off: If $0.07610 MA30 fails, step aside. Next solid buy zone is $0.07439 to $0.07200.
Bottom Line: DOGE bounced 10.8% from $0.06952 and 4h tries to turn up. 15m PDI > MDI and SAR support the short-term bid. But daily is still bearish, CCI/WR are high on 15m, and flow is below average. Break $0.07883 with new flow and $0.08787 opens. Reject it, and $0.07688 to $0.07439 is first.
Did you long the $0.06952 bottom or are you waiting for daily trend to flip? What’s your level? Drop it below.
$DOGE #Dogecoin #DOGE #Crypto
repost-content-media
  • Reward
  • Comment
  • 2
  • Share
Throughout June, the bitcoin market saw two sides move in completely opposite directions, making this divergence one of the market's most striking narratives.
US-based spot bitcoin ETFs experienced their worst month in history in June, with a net outflow of $4.06 billion, surpassing the previous record of $3.56 billion seen in February 2025 and turning total ETF flows negative for the first time in 2026. During the same period, but in the completely opposite direction, large investors, known as whales, bought over 270,000 bitcoins in two weeks, amounting to approximately $16.7 billion. The maj
SOL0.12%
Mansas19
Throughout June, the bitcoin market saw two sides move in completely opposite directions, making this divergence one of the market's most striking narratives.
US-based spot bitcoin ETFs experienced their worst month in history in June, with a net outflow of $4.06 billion, surpassing the previous record of $3.56 billion seen in February 2025 and turning total ETF flows negative for the first time in 2026. During the same period, but in the completely opposite direction, large investors, known as whales, bought over 270,000 bitcoins in two weeks, amounting to approximately $16.7 billion. The majority of these purchases occurred at prices between $58,000 and $62,000.
According to market analysts, this is a familiar pattern: large, long-term investors accumulating while institutions sell, a behavior that has emerged near the lows of past market cycles. Analysts emphasize that these periods, where long-term investors buy coins from sellers, usually occur before the price reaches a recovery point. A technical detail worth noting here is that the US spot premium was negative during the buying period, indicating that the purchases did not come from traditional US spot desks, meaning this demand came from somewhere outside the ETF creation mechanism.
On-chain data also confirms this picture from a different perspective; in early July, long-term investors, regardless of wallet size, returned to net accumulation mode. Furthermore, as of early July, approximately 10.8 million BTC were in unrealized losses while 9.2 million BTC were in profit, a ratio historically seen near capitulation zones, not at peak levels.
Market commentators compared this accumulation of 270,000 BTC to the lows experienced after the 2020 Covid crash and the late 2022 crash, both of which were periods of aggressive buying by large investors followed by a sustainable recovery. But a cautionary tale needs to be added here: such historical similarities don't guarantee a definitive outcome; in both past examples, the recovery didn't come instantly, it required clarification of macroeconomic conditions first.
Another detail that completes this picture is Solana's behavior. Even as Bitcoin touched its 21-month lows, SOL has risen by approximately 15% since early June, driven by protocol updates and a 120% increase in on-chain transfers of tokenized real-world assets, reaching $8.53 billion. Analysts have described this as a familiar pattern, with altcoins generally tending to fall before Bitcoin and recover before it.
Following these developments, Bitcoin tested the $62,000 mark, with the 200-week simple moving average, around $62,650, being watched as a critical line on a weekly basis. For those holding bitcoin positions through Gate, the real question is whether ETF flows will recover or whether macroeconomic pressure will force a new downward leg, because currently the two most closely watched capital groups in the market are making completely opposite bets at the same price levels, and how this disagreement is resolved looks like it will be the main story for bitcoin for the rest of the year.
DYOR 🔍 NFA ✅
$BTC
  • Reward
  • Comment
  • 1
  • Share
$CL Crude oil continued its consolidation trend at the start of the week, with WTI stuck around $68.60, briefly rising to $69.26 during the day before falling below $69 on Monday. This follows a weak attempt at a recovery that has continued since last Friday, but the strength of the recovery remains limited.
The situation in the Strait of Hormuz remains central to this pricing. According to the latest reports, some tankers were still making unusual route changes on Saturday, while major sea lanes reportedly returned to near-normal levels by Sunday. Saudi Arabia's crude oil exports have recover
CL0.10%
User_any
$CL Crude oil continued its consolidation trend at the start of the week, with WTI stuck around $68.60, briefly rising to $69.26 during the day before falling below $69 on Monday. This follows a weak attempt at a recovery that has continued since last Friday, but the strength of the recovery remains limited.
The situation in the Strait of Hormuz remains central to this pricing. According to the latest reports, some tankers were still making unusual route changes on Saturday, while major sea lanes reportedly returned to near-normal levels by Sunday. Saudi Arabia's crude oil exports have recovered to approximately ninety percent of pre-war levels, and the United Arab Emirates has similarly returned to pre-war export levels using the pipeline through the strait. Total daily flow through the strait has exceeded 10 million barrels.
However, supply-side pressure remains quite significant. OPEC+ has approved an additional production increase of 188,000 barrels per day for next month, primarily led by Saudi Arabia and Russia. Iran is also reportedly in talks to resume crude oil sales to Japanese companies under a temporary US sanctions waiver, which is reflected in expectations of additional supply to the market. Saudi Arabia also lowered its main crude oil price for Asia, discounting it to $1.50 per barrel compared to the Oman/Dubai reference, indicating that the supply surplus is also being felt on the pricing side.
However, geopolitical risk has not completely disappeared. Last week, the Iranian Revolutionary Guard warned tankers about unauthorized passage, and the dispute between Iran and the US over the long-term management of the strait and transit fees remains unresolved. Iran defines it as a maritime service fee, while the US argues that it is an international waterway and should not be charged. This unresolved dispute remains a real source of fragility underlying the current calm price environment.
The given resistance and support levels accurately reflect this balanced but tense environment. Short-term resistance starts at 68.90 and extends to 69.25, 69.95, 70.20, and 70.80, while support starts at 68.35 and extends to 68.00, 67.70, 67.40, and 67.00. The technical outlook remains weak at the moment; WTI is trading below its short-term moving averages, and the $70 level stands out as a critical ceiling. Some analysts suggest that if prices remain below this level, they could fall to $60, while a decisive breakout above $70 could reverse the outlook upwards.
For those following energy-related assets via the Gate, the key point to watch is that as long as transit through the strait continues to normalize, the geopolitical risk premium appears likely to continue eroding. However, it is still too early to assume this calm will be permanent until the transit fee dispute between Iran and the US is resolved. Any news of new friction could quickly break this narrow consolidation band upwards.
$XTIUSD $XBRUSD
DYOR 🔍
repost-content-media
  • Reward
  • Comment
  • 2
  • Share
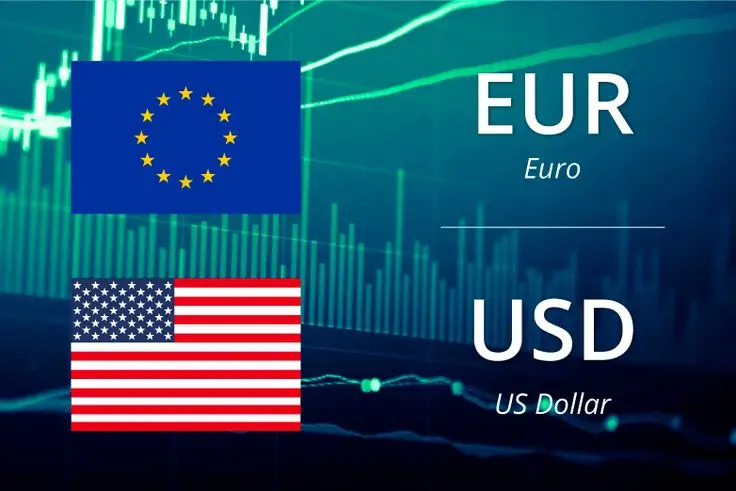
$EURUSD The euro has gained short-term momentum against the dollar, currently trading between 1.1424 and 1.1442, following a 0.5% weekly gain last week after weak employment data.
The story behind this movement is that both sides are largely balancing each other out. On the dollar side, June's non-farm payrolls data came in at just 57,000, significantly below expectations, and the unemployment rate fell to 4.2%, but this is due to a decline in labor force participation. This data significantly reduced the likelihood of a July rate hike, and the dollar is trading near its lowest level in two we
EURUSD0.02%
User_any
$EURUSD The euro has gained short-term momentum against the dollar, currently trading between 1.1424 and 1.1442, following a 0.5% weekly gain last week after weak employment data.
The story behind this movement is that both sides are largely balancing each other out. On the dollar side, June's non-farm payrolls data came in at just 57,000, significantly below expectations, and the unemployment rate fell to 4.2%, but this is due to a decline in labor force participation. This data significantly reduced the likelihood of a July rate hike, and the dollar is trading near its lowest level in two weeks. However, there is a similar softening on the euro side; June inflation fell to 2.8%, below expectations, and core inflation also dropped to 2.4%, leading European Central Bank President Christine Lagarde to present a more balanced outlook at the Sintra forum, making statements that weakened the possibility of a third rate hike.
So, while both central banks are signaling tightening on their side, signs of the limits of this tightening are emerging on both sides, which explains why the pair is stuck in a narrow range. The main determining event this week will be the release of the FOMC meeting minutes. If the minutes show that the Fed maintained its hawkish stance, the dollar could regain strength despite last week's weak employment data, increasing the likelihood of a continued downward trend in the pair. On the European Central Bank side, the next meeting is on July 23rd, and any official statements leading up to that date are also worth watching.
Looking at the given technical levels, a break above 1.1450 could bring 1.1462, 1.1472, and 1.1488 into play, which would be a scenario where the euro's short-term momentum continues. On the downside, a break below 1.1433 could open a series of declines to 1.1426, 1.1418, 1.1407, 1.1394, and 1.1378, signaling a resurgence of dollar strength. In a broader technical context, the 1.1400 level stands out as a critical reference point; a sustained drop below this level could mean the pair enters a much larger downtrend.
For those following dollar-linked assets and the crypto market through Gate, the key point to watch is whether this week's Fed minutes will reinforce the market's expectation of loose monetary policy following last week's weak employment data. This narrow range in the euro-dollar pair reflects a balance where both central banks are on a similar tightening trajectory, but the market is still unsure how long either can sustain it.
DYOR 🔍 NFA ✅
#TradFiCFDGoldMasters
repost-content-media
  • Reward
  • Comment
  • 2
  • Share
$USDJPY Japan's currency crisis has moved well past a simple exchange rate story and into something showing up directly in bankruptcy filings, bond yields, and the credibility of official intervention itself.
The corporate toll is now measurable and record setting. Forty five Japanese firms filed for bankruptcy in the first half of 2026 explicitly citing yen weakness as a cause, according to Tokyo Shoko Research, which only began tracking this category in 2022, making this the worst six month stretch on record, up more than 30 percent from 34 a year earlier. The damage is concentrated almost
USDJPY-0.13%
BTC0.34%
M谋ngYueZen
$USDJPY Japan's currency crisis has moved well past a simple exchange rate story and into something showing up directly in bankruptcy filings, bond yields, and the credibility of official intervention itself.
The corporate toll is now measurable and record setting. Forty five Japanese firms filed for bankruptcy in the first half of 2026 explicitly citing yen weakness as a cause, according to Tokyo Shoko Research, which only began tracking this category in 2022, making this the worst six month stretch on record, up more than 30 percent from 34 a year earlier. The damage is concentrated almost entirely among smaller firms, over three quarters of these bankruptcies involved companies with liabilities under 100 million yen, wholesale and import dependent businesses that have essentially no pricing power to pass rising costs onto customers. The mechanism making this worse for many smaller importers is a specific hedging instrument, reverse knockout options, which void themselves the moment the yen crosses a preset trigger level, forcing exactly the firms least equipped to absorb losses into buying dollars at the single worst possible moment.
The currency itself has been genuinely unstable this week rather than just steadily weak. USD/JPY pushed to 162 on Tuesday, its weakest since 1986 and effectively a four decade low, before yen bulls attempted a rebound past 161 on reports Tokyo might stop pre-signaling intervention plans, a tactic meant to catch speculative shorts off guard rather than telegraph moves the way April's operation did. That rebound gave back roughly half its gains by Monday as Tokyo again failed to actually intervene despite Finance Minister Satsuki Katayama repeating that authorities stand ready to act. Markets are increasingly skeptical any intervention delivers more than a temporary pause, April and May's combined interventions reportedly totaled a record 11.7 trillion yen, around 73 billion dollars, and the currency has still ground back toward these same lows.
The bond market side adds a genuinely difficult constraint on how Japan can respond. Ten year JGB yields have pushed up near multi decade highs, and for an economy carrying debt around 260 percent of GDP, financed for years on the assumption of persistently cheap yen funding, rising yields directly raise the government's own debt servicing costs. That creates the bind at the center of this whole situation, a weak yen feeds import driven inflation, but the Bank of Japan can't tighten fast enough to defend the currency without risking the debt service math becoming unsustainable. Goldman Sachs has reportedly revised its USD/JPY forecast up from 155 to 165, reflecting the view that yen weakness has further to run rather than nearing exhaustion, and other reporting suggests a push toward 170 isn't out of the question.
Tonight's calendar carries real weight given this backdrop. Japan releases labor cash earnings, current account, and bank lending data, and the read here matters more than usual, strong wage growth would raise the odds of further Bank of Japan tightening, while soft prints keep the central bank in a dovish holding pattern, meaning continued yen softness. This connects to broader risk assets in a fairly direct way, higher Japanese rates tend to drain global liquidity since Japan has long been a major funding source for carry trades into other assets, while continued BOJ dovishness acts as a liquidity tailwind. Outside Japan the calendar stays quiet until Wednesday's FOMC minutes, which remains the bigger catalyst this week.
For anyone tracking correlated macro risk across currencies, bonds, and crypto on Gate, the practical read is that USD/JPY, the dollar index, and Bitcoin liquidity conditions are worth watching together rather than separately this week. The underlying message from Japan's data run so far is straightforward, the corporate bankruptcy numbers show the weak yen is now actively breaking parts of the domestic economy, but the bond yield constraint means Tokyo has limited room to fix it quickly without creating a separate fiscal problem, and liquidity conditions tend to move risk assets more than headlines do.
DYOR 🔍
#TradFiCFDGoldMasters
  • Reward
  • Comment
  • 1
  • Share
$XRP ‌XRP $1.1485: +10.38% Week, Short-Term Bulls vs Daily Bear Drag. $1.17 Break or $1.12 Dip?
Quick Look
XRP is at $1.1485, up 1.17% today. 24h range: $1.1097 to $1.1695. Flow hit 27.21M XRP / $31.05M. After tagging $1.0093, XRP ran 16% to current levels. Short-term trend is up, but daily still fights a bear setup.
What The Chart Says: Short-Term Strong, Long-Term Heavy
1. 15m + 4h Trend Clean: MA5 $1.1444, MA10 $1.1423, MA30 $1.1233 are stacked and rising. MA7 > MA30 > MA120 on 4h confirms a bull setup. ADX over 30 backs strong momentum. Price holds above all three MAs. 2. Daily Still Be
XRP-1.32%
M谋ngYueZen
$XRP ‌XRP $1.1485: +10.38% Week, Short-Term Bulls vs Daily Bear Drag. $1.17 Break or $1.12 Dip?
Quick Look
XRP is at $1.1485, up 1.17% today. 24h range: $1.1097 to $1.1695. Flow hit 27.21M XRP / $31.05M. After tagging $1.0093, XRP ran 16% to current levels. Short-term trend is up, but daily still fights a bear setup.
What The Chart Says: Short-Term Strong, Long-Term Heavy
1. 15m + 4h Trend Clean: MA5 $1.1444, MA10 $1.1423, MA30 $1.1233 are stacked and rising. MA7 > MA30 > MA120 on 4h confirms a bull setup. ADX over 30 backs strong momentum. Price holds above all three MAs. 2. Daily Still Bearish: Daily shows MA7 < MA30 < MA120. That keeps the main trend down. SAR sits above price, flagging downside risk. Until daily flips, every rally faces overhead push. 3. Bullish Split On Daily: MACD shows a bullish split — price made a lower low at $1.0093, but DIF did not. Same for RSI. That means sell force is fading. If price holds $1.12 and MACD crosses up, the daily can turn.
Flow + Open Interest Red Flag
4h and daily flow show no major expansion. Contract open interest fell 4.8% from $1.525B to $1.453B. That’s cautious capital. Breakouts without flow tend to fail. Watch for $1.17 break with rising flow to confirm.
News Tailwinds vs Market Fear
1. ETF Inflows: XRP spot ETFs saw $22.99M net inflows last week. One issuer alone added $16.97M. Ongoing buy flow supports price. 2. MiCA Win: Ripple got full CASP approval in Luxembourg. That opens services across all 30 EEA states. Long-term bullish for clarity. 3. Market Risk Up: $164M in liquidations on July 6 hit both longs and shorts. VIX 24 and Fear & Greed at 24 show risk-off mood. Leverage is getting wiped.
Key Levels
The wall is $1.1695, the 24h high. Above it sits $1.2365, then $1.2933 June peak.
If Bulls Win: A 4h close over $1.17 with rising flow opens $1.2365 → $1.2933 → $1.3217. Break $1.2933 and daily bear setup breaks.
If Bears Step In: Lose $1.1485 and MA5 $1.1444 is first test. Below that, $1.1423 MA10 and $1.1233 MA30 line up. Break $1.1233 and $1.1097 24h low gets tested. Under $1.10, $1.0661 comes fast.
MACD Detail
4h MACD is -0.0029, with DIF 0.0138 under DEA 0.0167. Lines are tight and near a cross up. Histogram is flat. A cross from the low zone would match the daily bullish split and trigger a run at $1.2365.
Game Plan
Aggressive: $1.1444 to $1.1423 MA zone is bid area. Stop under $1.1390. Target $1.1695, then $1.2365.
Safe: Wait for a 1h close above $1.1720 with flow expansion. Then aim for $1.2365 and $1.2933.
Risk Off: If MA30 $1.1233 breaks, step aside. Next solid buy zone is $1.1097 to $1.0661.
Bottom Line: XRP short-term is bullish with MA7 > MA30 > MA120 and ADX > 30. Daily bullish split and ETF inflows add tailwind. But daily trend is still down, SAR is overhead, and open interest dropped 4.8%. $1.1695 is the gate. Break it with flow and $1.2365 is open. Reject it, and $1.1233 to $1.1097 is first.
Community sentiment is 89% bullish, but posts are down from 77 to 57 in 3 days. Fear index at 24 means chop ahead.
Are you trading the 4h trend or waiting for daily to flip? What’s your level? Drop it below.
$XRP #Ripple #XRP #Crypto
  • Reward
  • Comment
  • Repost
  • Share
Brazil's World Cup journey came to an end at New Jersey Stadium in New York. Norwich City, thanks to a brace from Haaland, defeated five-time champions Brazil 2-1, advancing to the quarterfinals and making history as the first team to reach the World Cup quarterfinals.
The turning point of the match came late in the second half. Haaland opened the scoring in the 79th minute with a header, and then extended the lead in the 90th minute with a low shot. Brazil's performance throughout the match was inconsistent. Goalkeeper Nyland saved a penalty from Guimarães in the first half and made several c
User_any
Brazil's World Cup journey came to an end at New Jersey Stadium in New York. Norwich City, thanks to a brace from Haaland, defeated five-time champions Brazil 2-1, advancing to the quarterfinals and making history as the first team to reach the World Cup quarterfinals.
The turning point of the match came late in the second half. Haaland opened the scoring in the 79th minute with a header, and then extended the lead in the 90th minute with a low shot. Brazil's performance throughout the match was inconsistent. Goalkeeper Nyland saved a penalty from Guimarães in the first half and made several crucial saves against Brazil. Neymar came on as a substitute in the 67th minute and converted a penalty in stoppage time to pull one back, but it was too late to save his team from elimination. This match may have been Neymar's last for the national team, and he hinted after the game that he would consider retiring.
For Brazil, this marks their sixth consecutive World Cup exit at the hands of European teams. Coach Ancelotti had hoped to end their 24-year title drought, but instead, they were eliminated early. Norwich, on the other hand, are making their World Cup knockout stage debut for the first time in 28 years. Haaland has scored seven goals in the tournament, tying Messi for the top scorer spot, and is also the first player in the club's history to score twice in a World Cup knockout match.
With the tournament concluded, all eyes immediately turned to another highly anticipated match: Portugal vs. Spain, a clash between the Iberian giants that captivated audiences. Spain remains unbeaten and has not conceded a goal in this tournament, boasting a solid defense and a formidable attack anchored by Yamal and Oyarzabal. Portugal, relying on the attacking duo of Ronaldo and Ramos, has fought their way through the tournament, with Ramos's injury-time winner eliminating Croatia in the previous round. The two teams have a very close record in their last ten encounters, with six draws, two wins, and two losses. Their last meeting was in last year's UEFA Nations League final, where Portugal defeated Spain on penalties to win the title.
Norwich will next face the winner of the Mexico vs. England match in their final game before the semi-finals. As for the crucial match between Portugal and Spain, who will emerge victorious? Head over to Gate.com and share your predictions.
https://gate.onelink.me/Hls0/prediction?page=world_cup&tab=group&source=cex
repost-content-media
  • Reward
  • Comment
  • Repost
  • Share
$USDPT is a dollar-backed stablecoin launched by Western Union, one of the world's largest money transfer companies. Officially launched in May, this token operates on the Solana blockchain and is issued by Anchorage Digital Bank, a federally regulated institution, giving it a regulatory framework from the outset, unlike many other new stablecoins.
The motivation behind this move is quite clear: Western Union aims to replace the traditional interbank clearing systems it has used for over 150 years, particularly slow and costly infrastructure like SWIFT, with blockchain-based instant clearing.
USDPT-0.20%
SOL0.12%
User_any
$USDPT is a dollar-backed stablecoin launched by Western Union, one of the world's largest money transfer companies. Officially launched in May, this token operates on the Solana blockchain and is issued by Anchorage Digital Bank, a federally regulated institution, giving it a regulatory framework from the outset, unlike many other new stablecoins.
The motivation behind this move is quite clear: Western Union aims to replace the traditional interbank clearing systems it has used for over 150 years, particularly slow and costly infrastructure like SWIFT, with blockchain-based instant clearing. The company's initial focus isn't on the consumer side, but on its agent network, which provides instant liquidity to over 400,000 agents in more than 200 countries. This allows the company to reduce the need to hold funds in different regions and utilize its capital much more efficiently.
But the plan isn't limited to the institutional side; steps towards the consumer side are also on the agenda. A spending product called Stable by Western Union will be launched in over forty countries this year, allowing users to hold USDPT balances and spend them in their local currency. A separate card product targeting users in high-inflation markets is also under development, allowing them to make purchases through standard card infrastructure while preserving the value of their dollars. The company has also established a Digital Asset Network that directly connects crypto wallets to its global retail infrastructure, enabling users to convert their digital assets into local currency at physical locations worldwide.
In terms of numbers, the total stablecoin market currently exceeds $300 billion, with Tether's USDT leading the way at approximately $190 billion. Western Union's entry into this market, with its existing customer base of hundreds of millions and physical presence in over two hundred countries, positions it very differently from a typical stablecoin project starting from scratch, as its distribution infrastructure is already established and operational.
Gate's provision of access to this asset means users can directly access this new token, which is entering Western Union's global payment ecosystem, through the marketplace. For those following USDPT on Gate, the key point to watch is the extent to which its use in institutional clearing will expand over time to consumer spending products. If this expansion occurs, USDPT could become one of the most deeply integrated tokens into real-world payment networks compared to existing stablecoin giants.
https://www.gate.com/trade/USDPT_USDT
repost-content-media
  • Reward
  • Comment
  • Repost
  • Share
#GTBurns2.57MInQ2 $GT
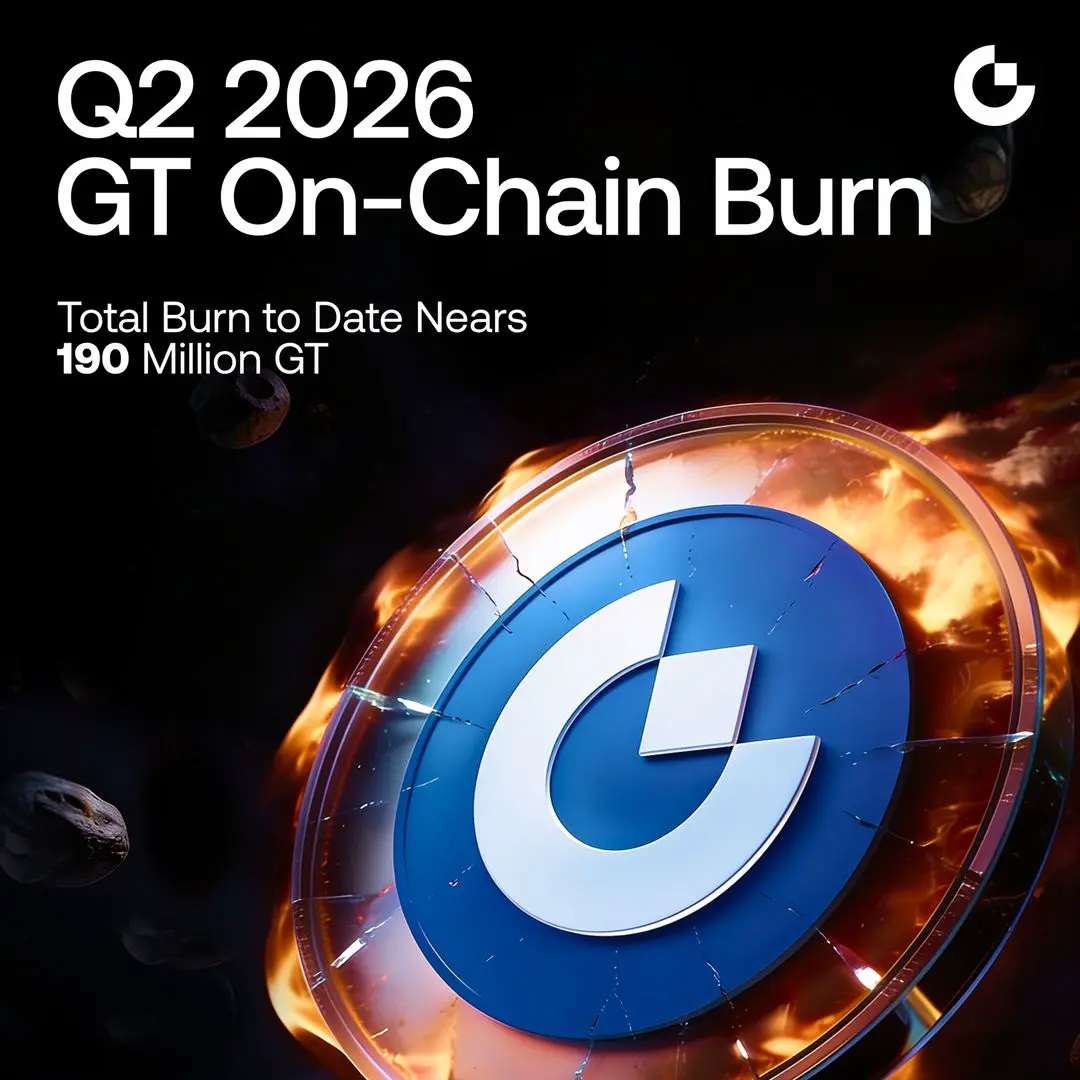
Gate announced the completion of its GT burn for the second quarter of 2026. During this quarter, 2,570,063 GT were permanently burned to their respective addresses on the chain, with a market value exceeding $17.75 million. All details of the process are transparently viewable on the Ethereum blockchain.
This burn is a continuation of the deflationary mechanism that has been in place since the Gate Chain mainnet went live in 2019. To date, a total of 189.9 million GT have been permanently removed from circulation, meaning the total burn value exceeds $1.31 billion. Bas
GT0.88%
User_any
#GTBurns2.57MInQ2 $GT
Gate announced the completion of its GT burn for the second quarter of 2026. During this quarter, 2,570,063 GT were permanently burned to their respective addresses on the chain, with a market value exceeding $17.75 million. All details of the process are transparently viewable on the Ethereum blockchain.
This burn is a continuation of the deflationary mechanism that has been in place since the Gate Chain mainnet went live in 2019. To date, a total of 189.9 million GT have been permanently removed from circulation, meaning the total burn value exceeds $1.31 billion. Based on the initial total supply of 300 million, this cumulative burn has reduced the total supply by approximately 63.32%, meaning more than two-thirds of the initial supply has been irrevocably removed from circulation.
The logic behind this regular and transparent burn strategy is quite simple: as the supply decreases and the ecosystem grows, the scarcity of remaining tokens in circulation increases. Gate has consistently maintained this token burning program for several market cycles, demonstrating a long-term commitment independent of short-term market fluctuations.
It's important to note that Gate hasn't limited this strategy to token burning alone; it has also been expanding its multi-asset trading infrastructure and application ecosystem in parallel. This simultaneous development of the product ecosystem alongside the deflationary mechanism is part of a holistic approach aimed at strengthening GT's scarcity and long-term value.
For those holding GT positions through Gate or following the platform's long-term strategy, the key point is that the regular and predictable quarterly rhythm of this burning program, regardless of market conditions, serves as a concrete demonstration of the platform's long-term commitment to the token economy.
https://www.gate.com/announcements/article/100511
repost-content-media
  • Reward
  • Comment
  • Repost
  • Share
📣 Let's Talk About Gate Chat!
You chat in the community every day—
Is there a feature you've always wanted Gate Chat to add?
Now's your chance to help shape the next Gate Chat update! 👇
✅ Complete the Product Feedback Survey
✅ Share your real experience and suggestions
✅ 100% guaranteed to receive a 5 USDT Futures Position Voucher
🏆 Outstanding Suggestion Awards
🔹 3 × 1,000 USDT Futures Position Vouchers
🔹 20 × 100 USDT Futures Position Vouchers
🔹 100 × 20 USDT Futures Position Vouchers
💡 Your suggestion could become part of the next Gate Chat update!
👉 Survey: https://www.gate.co
Gate_Square
📣 Let's Talk About Gate Chat!
You chat in the community every day—
Is there a feature you've always wanted Gate Chat to add?
Now's your chance to help shape the next Gate Chat update! 👇
✅ Complete the Product Feedback Survey
✅ Share your real experience and suggestions
✅ 100% guaranteed to receive a 5 USDT Futures Position Voucher
🏆 Outstanding Suggestion Awards
🔹 3 × 1,000 USDT Futures Position Vouchers
🔹 20 × 100 USDT Futures Position Vouchers
🔹 100 × 20 USDT Futures Position Vouchers
💡 Your suggestion could become part of the next Gate Chat update!
👉 Survey: https://www.gate.com/zh/questionnaire/7774
📄 Campaign Details: https://www.gate.com/zh/announcements/article/100495
repost-content-media
  • Reward
  • Comment
  • 1
  • Share
$ETH #ETHReclaims1800
Ethereum has clawed back above $1,800, putting it back at a level it hasn't touched since mid June, when the broader crypto market first started rolling over into the sharp correction that followed. Other trackers show ETH a touch lower, in the $1,715 to $1,796 zone, so the exact print above $1,800 may already be fading slightly, but the direction and scale of the recovery are consistent across sources, this is a genuine multi-week high, not a blip.
The path to get here has been genuinely rough. ETH fell as much as 54 percent from January's peak nea
ETH0.19%
BTC0.34%
User_any
$ETH #ETHReclaims1800
Ethereum has clawed back above $1,800, putting it back at a level it hasn't touched since mid June, when the broader crypto market first started rolling over into the sharp correction that followed. Other trackers show ETH a touch lower, in the $1,715 to $1,796 zone, so the exact print above $1,800 may already be fading slightly, but the direction and scale of the recovery are consistent across sources, this is a genuine multi-week high, not a blip.
The path to get here has been genuinely rough. ETH fell as much as 54 percent from January's peak near $3,400 during the depths of the recent downturn, at one point trading under $1,550 with technical structure that several analysts described as deeply bearish, warning of further downside toward $1,400 or even $1,200 if selling accelerated. The Ethereum Foundation even cut a fifth of its staff and slashed its budget during that stretch, and spot Ether ETFs logged five consecutive sessions of outflows with zero positive flow days at the low point.
What's turned this around lines up with the broader macro shift that's lifted crypto generally over the past few days. Weak US jobs data reignited hopes for Federal Reserve easing, weakening the dollar and pulling risk appetite back into both bitcoin and ether simultaneously. Ethereum specifically has also picked up some fundamental tailwinds on top of that macro backdrop. A new nonprofit called Ethereum Institutional launched on July 1, backed by co-founder Joseph Lubin along with major ETH treasury companies, aimed at giving banks and asset managers a credible, neutral point of contact for navigating the ecosystem, a structural piece addressing one of the recurring institutional adoption complaints. SharpLink also resumed its ETH accumulation with a fresh $16 million purchase during the dip, signaling continued long-term conviction from at least one major corporate holder even while price was still falling.
The technical read now shifts meaningfully depending on which level holds. The 20-day EMA sits right around this $1,700 to $1,710 zone, and reclaiming it has been treated by chart watchers as the first real signal of a meaningful recovery attempt, with the 50-day EMA near $1,865 as the next test above that. A failure to hold above this zone would put ETH right back into the choppy, bearish structure that dominated most of June.
For anyone tracking ETH on Gate, the more important question from here isn't the $1,800 print itself but whether it holds. Reclaiming and sustaining a position above the 20-day EMA with real volume would be a genuinely different signal than the repeated failed bounce attempts seen throughout June, while a quick reversal back below $1,700 would suggest this is another relief rally within a still intact downtrend rather than a confirmed turn.
DYOR 🔍 NFA ✅
repost-content-media
  • Reward
  • Comment
  • 2
  • Share
🇦🇺 Australia vs Egypt, crucial knockout match in the Round of 32!
The World Cup Round of 32 continues as Australia takes on Egypt. One game decides it all, with zero margin for error. Do you favor Australia's tough style of play, or Egypt's ability to advance with their attacking power?
⏰ Match time: July 4, 2026 02:00 (UTC+8)
👉 Participate in prediction: https://gate.onelink.me/Hls0/prediction?page=detail&event_ticker=640362&source=cex
Come to Gate Polymarket and predict this Round of 32 knockout match!
GateSquare
🇦🇺 Australia vs Egypt, crucial knockout match in the Round of 32!
The World Cup Round of 32 continues as Australia takes on Egypt. One game decides it all, with zero margin for error. Do you favor Australia's tough style of play, or Egypt's ability to advance with their attacking power?
⏰ Match time: July 4, 2026 02:00 (UTC+8)
👉 Participate in prediction: https://gate.onelink.me/Hls0/prediction?page=detail&event_ticker=640362&source=cex
Come to Gate Polymarket and predict this Round of 32 knockout match!
repost-content-media
  • Reward
  • Comment
  • Repost
  • Share
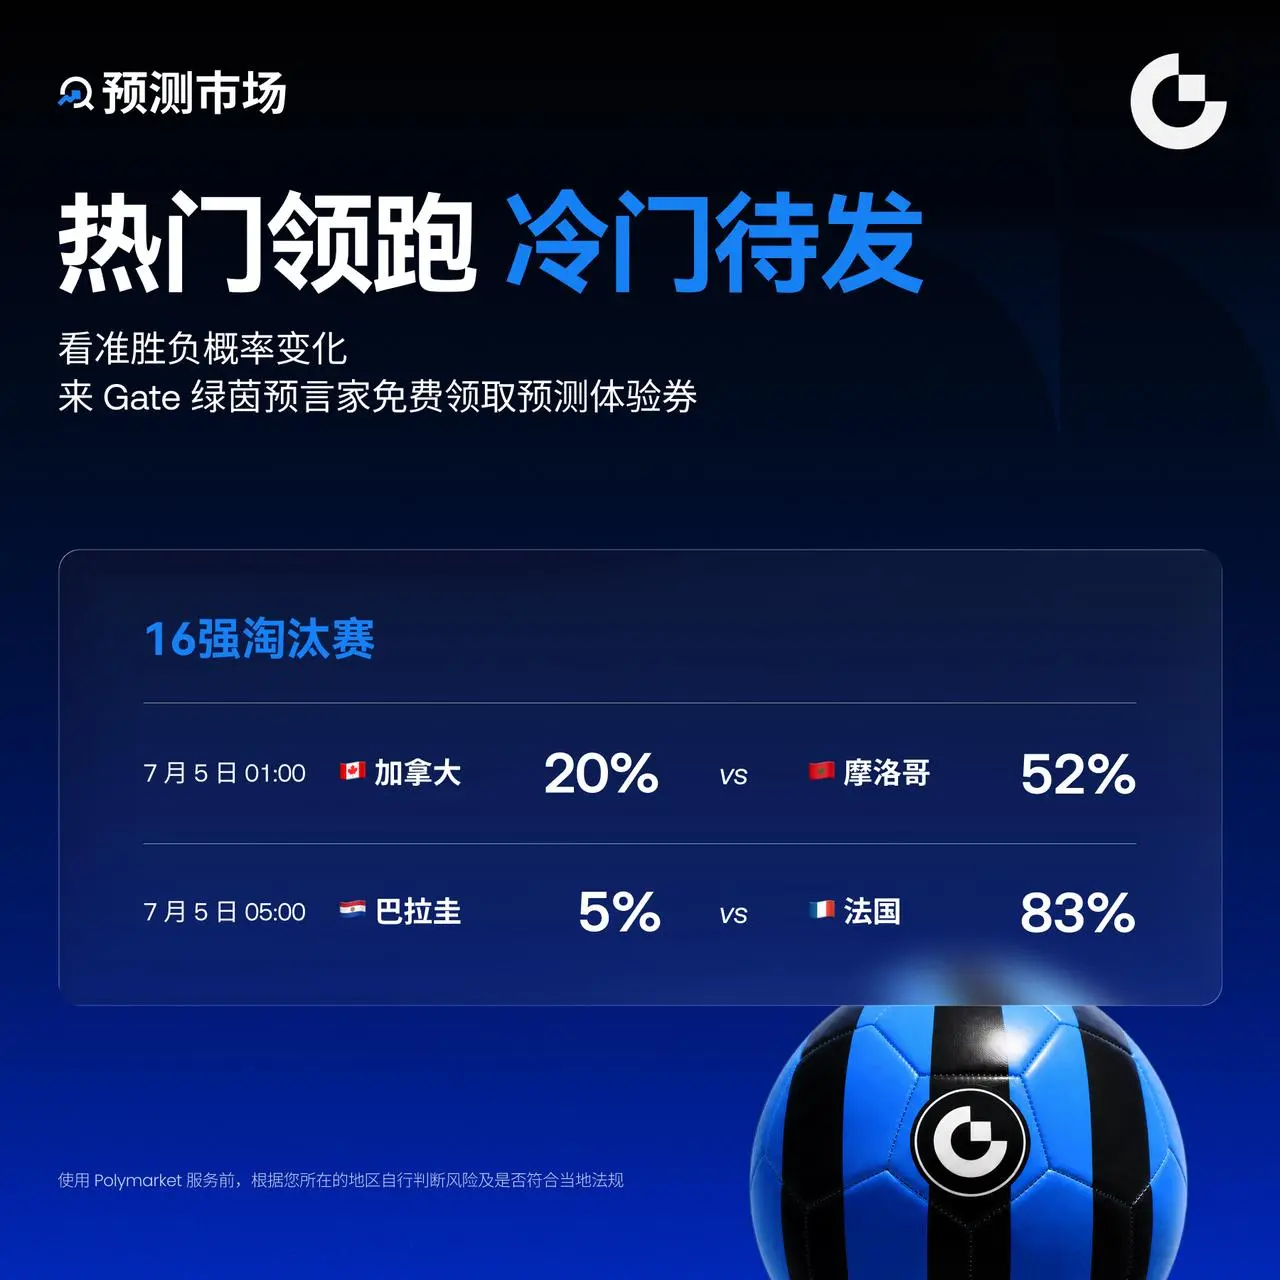
⚽ France pushes for advancement, Morocco leads in popularity.
France win rate 83%, can Paraguay cause an upset?
Morocco win rate 52%, Canada still has a chance to fight back.
The further into the knockout stage, the faster the price changes.
Watch the probability fluctuations, and you can also exit early to lock in opportunities.
👉 Participate now: https://www.gate.com/competition/road-to-champion
GateLaunch
⚽ France pushes for advancement, Morocco leads in popularity.
France win rate 83%, can Paraguay cause an upset?
Morocco win rate 52%, Canada still has a chance to fight back.
The further into the knockout stage, the faster the price changes.
Watch the probability fluctuations, and you can also exit early to lock in opportunities.
👉 Participate now: https://www.gate.com/competition/road-to-champion
repost-content-media
  • Reward
  • Comment
  • Repost
  • Share
🍉 GT Summer Benefits Station is in full swing!
Double benefits for holding and trading—share 2,500 GT + 350,000 USDT!
1️⃣ Register to claim 0.1 GT
2️⃣ Complete trading challenges to share 1,500 GT + 350,000 USDT
3️⃣ Join the GT Lucky Star to win another 500 GT
Join now: https://gate.onelink.me/7pdk/9f9dd7356bf8d7e2
Announcement: https://www.gate.com/announcements/article/100150
GT0.88%
  • Reward
  • Comment
  • 2
  • Share
$XRP
So XRP is sitting around 1.15, up 11 percent on the week, which sounds great until you realize the daily chart is still in a clear downtrend. MA7 is below MA30, which is below MA120. That is a bearish alignment, plain and simple.
The short term charts are bullish, no question. The 15 minute and 4 hour trends are pointing up, momentum is strong, and price is holding above that 1.1578 level, which is the 20 period moving average on the 15 minute. That is your line in the sand for the short term trade.
But here is the problem. The 4 hour RSI is at 80.44 and the daily J value is at 113.63. T
XRP-1.32%
M谋ngYueZen
$XRP
So XRP is sitting around 1.15, up 11 percent on the week, which sounds great until you realize the daily chart is still in a clear downtrend. MA7 is below MA30, which is below MA120. That is a bearish alignment, plain and simple.
The short term charts are bullish, no question. The 15 minute and 4 hour trends are pointing up, momentum is strong, and price is holding above that 1.1578 level, which is the 20 period moving average on the 15 minute. That is your line in the sand for the short term trade.
But here is the problem. The 4 hour RSI is at 80.44 and the daily J value is at 113.63. Those are extreme readings. When you see numbers like that, you are either in a monster trend or you are about to get smacked. And given that the daily trend is still bearish, the smart money is probably leaning toward the latter.
The framework here is really about time horizon conflict. Short term traders are buying because the momentum says go. Long term holders are either selling or just watching because the structure says no. And the danger is that you look at the 15 minute chart, see strength, and use that to override what the daily chart is telling you. That is a cognitive bias, local optimism, and it gets traders burned all the time.
The most dangerous emotion right now is greed. Price moved up 11 percent in a week, and FOMO is real. But the RSI is screaming that you are late to this move if you are trying to buy right here.
So what is the play? If you are long, trail your stop below that 1.1578 level and think about taking some profits. If you are flat, wait. Let the 4 hour RSI cool off to 65 or below before you even think about entering. And if you are short, wait for a break below that support level with volume to confirm.
The daily trend is still the boss. The 4 hour trend is just an employee, and right now that employee is tired and overextended. Respect the boss.
DYOR 🔍 NFA ✅
  • Reward
  • Comment
  • 1
  • Share
⏰ Have You Joined Today's Gate Square Lucky Draw?
100% Win Rate! Win up to $10,000 in CFD Vouchers with our upgraded prize pool!
Enter Now 👉 https://www.gate.com/zh/activities/pointprize?now_period=20
Win CFD Position Vouchers, Prediction Market Vouchers, Fee Rebate Vouchers and more!
No trading required—just post and engage on Gate Square!
Details: https://www.gate.com/announcements/article/100364
#BTC #ETH #SPCX
BTC0.34%
ETH0.19%
SPCX-3.19%
M谋ngYueZen
⏰ Have You Joined Today's Gate Square Lucky Draw?
100% Win Rate! Win up to $10,000 in CFD Vouchers with our upgraded prize pool!
Enter Now 👉 https://www.gate.com/zh/activities/pointprize?now_period=20
Win CFD Position Vouchers, Prediction Market Vouchers, Fee Rebate Vouchers and more!
No trading required—just post and engage on Gate Square!
Details: https://www.gate.com/announcements/article/100364
#BTC #ETH #SPCX
  • Reward
  • Comment
  • Repost
  • Share
  • Pinned