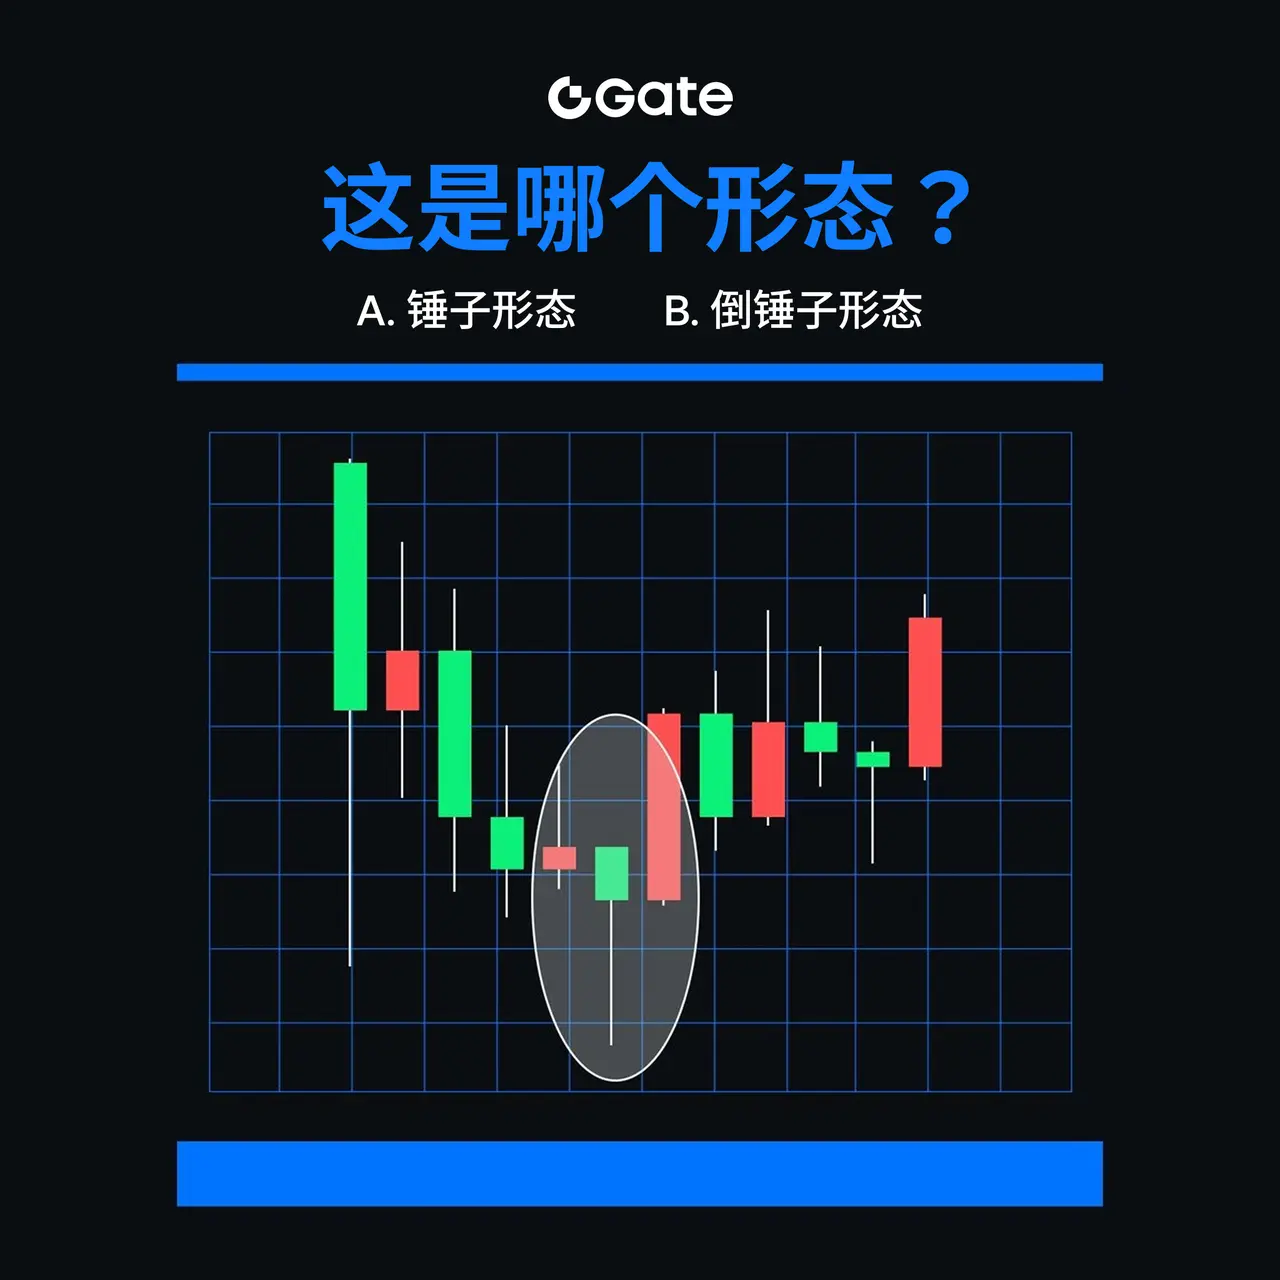
Mr_Thynk

vip
Age 0.9 Year
Peak Tier 0
No content yet
#Get2SharesOfSKHynixAtZeroCost
SK Hynix, South Korea's semiconductor memory chip giant and Nvidia's critical HBM supply partner, is executing the most ambitious dual strategic maneuver in the global chip industry: a blockbuster Nasdaq listing that could raise up to $29.4 billion alongside a massive 10-year investment plan jointly announced with Samsung Electronics totaling up to 2,000 trillion won ($1.3 trillion). The "Get 2 Shares at Zero Cost" promotion framing captures the promotional incentive structure surrounding SK Hynix's Nasdaq ADR listing, where the company plans to issue 17.79 mill
Falcon_Official
Gate has introduced a promotional campaign that enables eligible users to earn up to two SK Hynix shares at zero cost by participating in qualifying stock trading activities on the Gate Stocks platform. The initiative is designed to expand access to tokenized stock investing while rewarding users with exposure to one of the world's leading AI memory semiconductor companies through a simple participation-based incentive.
The #Get2SharesOfSKHynixAtZeroCost is trending after Gate launched a promotional campaign allowing eligible users to earn up to 2 SK Hynix shares at zero cost by participating in stock trading activities on the Gate Stocks platform. The campaign is designed to introduce new users to tokenized stock investing while rewarding active participants with fractional SK Hynix stock rewards.
According to the official campaign announcement, users must register for the event, complete the required trading tasks within the Gate Stocks section, and satisfy the campaign's eligibility requirements before the promotion ends. Rewards are distributed from a dedicated prize pool in the form of fractional stock equivalents. The campaign runs from June 23, 2026, to June 30, 2026 (UTC), with participation subject to Gate's official terms and conditions.
About SK Hynix
SK Hynix has become one of the world's most important semiconductor manufacturers.
The South Korean technology giant is the second-largest memory chip producer globally, specializing in DRAM, NAND Flash, and High Bandwidth Memory (HBM) solutions that power artificial intelligence servers, cloud computing infrastructure, enterprise storage, and next-generation data centers.
The company remains one of NVIDIA's largest HBM suppliers, making its products essential for training and deploying modern AI models. Continued investment in advanced memory technologies has positioned SK Hynix among the biggest beneficiaries of the global AI infrastructure boom.
Business Performance
SK Hynix continues delivering exceptionally strong financial performance as AI-driven demand accelerates.
The company recently announced plans to raise up to $29.4 billion through a Nasdaq ADR listing, one of the largest technology offerings ever announced. Management stated that the proceeds will support construction of new semiconductor facilities, advanced packaging capacity, and additional EUV lithography equipment to expand future production.
Recent quarterly results also showed a fivefold increase in net profit, reflecting surging demand for advanced memory products used in AI accelerators and cloud infrastructure. HBM production for 2026 has reportedly been fully allocated, highlighting persistent supply constraints across the semiconductor industry.
AI Market Connection
Artificial intelligence remains the primary catalyst behind SK Hynix's rapid expansion.
Every large AI data center requires enormous quantities of High Bandwidth Memory to support increasingly powerful GPUs used for generative AI, machine learning, and large language models.
As demand from hyperscale cloud providers continues increasing, memory suppliers capable of manufacturing advanced HBM products remain in a favorable competitive position. Industry analysts expect AI infrastructure spending to remain one of the strongest long-term growth drivers for the semiconductor sector.
This structural demand has significantly strengthened investor confidence in companies supplying critical AI hardware components.
Stock Performance
Investor sentiment toward SK Hynix has strengthened considerably throughout 2026.
Following confirmation of its planned Nasdaq ADR listing, the company's shares moved sharply higher as investors welcomed broader access for international institutions. SK Hynix has also become one of South Korea's most valuable publicly traded companies, supported by continued AI-related demand and strong earnings momentum.
Analysts believe a successful U.S. listing could improve liquidity, increase institutional ownership, and reduce the historical valuation gap between SK Hynix and major U.S. semiconductor companies. Nevertheless, semiconductor stocks remain sensitive to interest-rate expectations, global economic conditions, and short-term profit-taking.
Risk & Disclaimer
While the campaign provides an opportunity to earn SK Hynix shares without purchasing them directly, participation remains subject to official campaign rules, eligibility requirements, regional restrictions, and reward availability.
Investors should also remember that semiconductor companies operate within a highly cyclical industry influenced by AI spending, technology demand, geopolitical developments, and macroeconomic conditions.
Promotional rewards should not be interpreted as investment recommendations, and stock prices can fluctuate significantly after major corporate events.
Always read the official campaign terms carefully and conduct your own research before participating or investing.
Bottom Line
The #Get2SharesOfSKHynixAtZeroCost campaign combines promotional rewards with one of the strongest AI investment themes of 2026.
Supported by booming HBM demand, expanding semiconductor capacity, record earnings, and a historic Nasdaq ADR listing, SK Hynix remains at the center of the global AI hardware revolution. For eligible Gate users, the campaign offers an opportunity to gain exposure through promotional rewards while learning about the rapidly growing semiconductor sector.
#Get2SharesOfSKHynixAtZeroCost
@Gate_Square
repost-content-media
  • Reward
  • Comment
  • Repost
  • Share
#SaylorHintsAtMoreBTC
Michael Saylor has once again signaled that Strategy is preparing to acquire more Bitcoin, posting on X on June 28 the company's Bitcoin acquisition tracker alongside the characteristic teaser: "We're gonna need more charts." This follows the same playbook Saylor has deployed throughout June, with similar posts on June 7 and June 21 preceding formal disclosures of additional purchases. The latest StrategyTracker data reveals that Strategy holds 847,363 BTC valued at $50.88 billion as of June 28, accumulated through 113 purchase events at an average cost basis of $75,653
BTC0.03%
Yusfirah
#SaylorHintsAtMoreBTC
Michael Saylor, the Executive Chairman of Strategy and one of the most prominent Bitcoin advocates globally, has recently signaled the possibility of additional Bitcoin acquisitions. This development carries significant weight in the cryptocurrency market, as Saylor and his company have established themselves as institutional pioneers in Bitcoin treasury management.
Understanding the Saylor Effect
Michael Saylor has built a reputation as the ultimate Bitcoin bull through Strategy's aggressive accumulation strategy. The company currently holds approximately 847,363 BTC, making it one of the largest corporate Bitcoin holders worldwide. When Saylor hints at more purchases, market participants pay close attention because his company has consistently executed large-scale acquisitions in the past.
On June 22, 2026, Strategy acquired an additional 520 BTC for $35 million, bringing their total holdings to the current level. Furthermore, the company has bolstered its USD reserves by $300 million to reach $1.4 billion, with plans to continue replenishing these reserves to support their Digital Credit securities. This financial positioning suggests they have substantial dry powder available for future Bitcoin purchases.
Saylor's recent social media activity reinforces this bullish stance. His statements emphasize that Strategy remains laser-focused on Bitcoin accumulation, disciplined capital allocation, and long-term value creation even amid market volatility. Posts like "Bitcoin is working today. So are we" demonstrate his unwavering commitment to the asset.
Current Bitcoin Market Position
Bitcoin is currently trading at approximately $60,150, having recently tested the $58,000 level on the downside. This price action reflects a market under significant pressure, with the Fear and Greed Index sitting at 13, indicating extreme fear among market participants.
The technical picture presents a mixed but predominantly bearish outlook. Bitcoin is trading below all major daily moving averages, including the 20-day EMA at $63,856, the 50-day EMA at $67,873, and the 200-day EMA at $77,268. This configuration confirms a bearish regime that requires careful navigation by traders and investors.
Technical Analysis: Support and Resistance Levels
Support Levels
The immediate support zone sits at $58,729, which aligns with recent price action where Bitcoin briefly touched $58,000. This level represents a critical psychological and technical floor. A breakdown below this zone could expose Bitcoin to further downside toward the $56,120 to $57,340 range in the short term.
The medium-term support structure extends lower to the $50,020 to $53,090 range. Some analysts suggest that a bear flag formation could potentially target levels near $47,000 if the current support structure fails. However, such a move would likely require a significant capitulation event with volume expansion.
Resistance Levels
On the upside, the $61,152 level represents the first meaningful resistance that Bitcoin must overcome. Beyond this, the $63,000 to $64,000 zone stands as the most consequential barrier for any bullish reversal attempt. A sustained close above $64,000 would open the path toward $65,000, $66,000, and potentially $68,000.
The $63,500 level carries particular significance as a breakout trigger. Hourly closes above this level could signal the beginning of a relief rally, though traders should remain cautious until daily closes confirm the strength of any upward move.
RSI Analysis
The Relative Strength Index (RSI) currently registers around 32 on the daily timeframe, indicating deeply oversold conditions without reaching the extreme capitulation levels typically associated with major bottoms. On shorter timeframes, the RSI has printed readings as low as 17 to 24, suggesting that while momentum remains bearish, the potential for a technical bounce exists.
The RSI positioning suggests that Bitcoin is experiencing significant stress but has not yet reached the panic selling phase that often marks major cycle lows. This creates a scenario where patient accumulation could prove advantageous for long-term investors.
Strategic Investment Plans for Different Market Participants
Conservative Accumulation Strategy
For risk-averse investors seeking exposure to Bitcoin, a dollar-cost averaging approach remains prudent. Consider establishing small positions at current levels near $60,150, with plans to scale in further if prices decline toward the $58,000 support zone. This method mitigates the risk of catching a falling knife while ensuring participation in any potential recovery.
Set buy orders in tranches at $59,500, $58,500, and $57,000 to capture any further downside. Maintain a long-term holding perspective, as the Saylor announcement could provide fundamental support for prices over the coming weeks.
Moderate Risk Strategy
Traders with higher risk tolerance might consider initiating partial positions at current levels while maintaining flexibility to add on weakness. The confluence of oversold technical conditions and potential institutional buying creates an attractive risk-reward setup for those willing to accept short-term volatility.
Watch for a confirmed hourly close above $63,500 as a signal to increase exposure, with stops placed below the recent swing low at $58,000. Target initial profits near $66,000, with the option to trail stops higher if momentum continues.
Aggressive Trading Approach
Active traders can exploit the current volatility by monitoring the $58,000 to $64,000 range. Consider long positions on bounces from the $58,500 to $59,500 zone with tight risk management. The oversold RSI readings on shorter timeframes support counter-trend bounce scenarios, though the broader trend remains bearish.
Use $61,000 as a pivot point for intraday decisions, with breakout entries above $63,300 targeting $64,500 and $65,000. Invalidation occurs on moves back below $62,800, requiring disciplined stop-loss management.
Market Outlook and Price Fluctuation Expectations
The announcement of potential Saylor purchases introduces a bullish catalyst into a technically weak market. Historically, when Strategy announces or executes significant Bitcoin acquisitions, prices tend to experience upward pressure as other market participants anticipate the buying activity.
However, the current technical structure suggests that any rally will face substantial resistance. The $63,000 to $64,000 zone represents a major hurdle that requires significant buying conviction to overcome. Until Bitcoin can reclaim and hold above the 20-day EMA at $63,856, the path of least resistance remains lower.
Price fluctuations in the coming days could see Bitcoin oscillate between $58,000 and $64,000 as bulls and bears battle for control. A decisive break above $64,000 would shift the technical outlook to neutral-bullish, while a failure to hold $58,000 would open the door to deeper corrections toward $53,000 or lower.
Conclusion
Michael Saylor's hints at additional Bitcoin purchases provide a compelling fundamental backdrop for the cryptocurrency. While technical conditions remain challenging, the combination of deeply oversold readings and potential institutional buying creates an interesting setup for patient investors.
Traders should remain disciplined, respecting the current bearish trend while positioning for potential upside. The key levels to watch are $58,000 support and $64,000 resistance, with RSI readings providing additional context for timing decisions.
Gate stands as the premier platform for executing these strategies, offering robust trading infrastructure, competitive fees, and comprehensive market analysis tools. Whether you are accumulating for the long term or trading short-term fluctuations, Gate provides the ideal environment for Bitcoin investment.
For those seeking passive income opportunities, consider exploring Gate's USD1 holding yield program, which allows you to earn returns simply by holding assets without active trading. This approach aligns perfectly with the Saylor philosophy of long-term Bitcoin accumulation while generating additional yield on your holdings.@Gate_Square
  • Reward
  • Comment
  • Repost
  • Share
#SolanaEcosystemANSEMSurges
The Solana ecosystem is experiencing a significant resurgence in June 2026, driven by multiple converging narratives spanning tokenized assets, memecoin activity, DeFi infrastructure expansion, and institutional capital flows. While specific ANS and EMS token surges reflect the network's continued memecoin vitality, the broader ecosystem momentum provides the fundamental backdrop that makes such token movements possible and sustainable.
Solana's dominance in tokenized equities has reached unprecedented levels. Tokenized stock trading volume on Solana hit $4.9 billi
  • Reward
  • Comment
  • Repost
  • Share
#TradFiCFDGoldMasters
Gate has launched the TradFi CFD Gold Masters tournament, a landmark event that bridges the gap between cryptocurrency trading and traditional financial markets within a single platform ecosystem. This initiative represents the next evolution of Gate's TradFi feature, which officially debuted in mid-January 2026 and has been progressively expanded to include contracts for difference covering gold, silver, crude oil, forex pairs, US stock indices, and popular equities. The Gold Masters tournament offers users the opportunity to compete on trading leaderboards, participate
XAU-1.16%
XAG-2.20%
Falcon_Official
$XAU ‌Gold remains one of the most actively traded assets in global financial markets, and the TradFi CFD Gold Masters campaign provides traders with an opportunity to sharpen their trading strategies through Gold Contracts for Difference (CFDs). By combining competitive trading objectives with exposure to real-time gold price movements, the campaign highlights how modern CFD products enable market participants to capitalize on both bullish and bearish conditions while emphasizing disciplined risk management and informed decision-making.
The #TradFiCFDGoldMasters is gaining momentum as Gate continues its flagship TradFi CFD Gold Masters Tournament, giving traders the opportunity to compete for one of the platform's largest promotional prize pools. The campaign combines traditional financial markets with crypto-based trading by allowing eligible users to trade Gold CFDs and other TradFi assets while competing for leaderboard rewards, hourly gold lucky draws, and newcomer bonuses.
The campaign runs from June 11, 2026, to July 11, 2026 (UTC). Eligible users must register through the official campaign page before completing qualifying TradFi CFD trading tasks. Participants can earn rewards through trading volume rankings, ROI leaderboards, referral tasks, VIP missions, and hourly Gold Lucky Bag draws. The total reward pool includes up to 500,000 USDT equivalent prizes together with 1,020 grams of gold distributed as XAUT tokens, subject to the official campaign terms and conditions.
Gold CFD Trading
Contracts for Difference (CFDs) allow traders to speculate on gold price movements without owning physical gold.
Through Gate TradFi CFD, traders can open long positions if they expect gold prices to rise or short positions if they anticipate a decline. Positions are cash-settled, meaning profits and losses are based solely on price differences between entry and exit. The platform also supports leveraged trading, allowing participants to control larger market exposure with a smaller margin deposit. While leverage increases potential returns, it also magnifies potential losses and should always be used responsibly.
Trading Requirements
The campaign supports multiple TradFi CFD markets including Gold (XAU/USD), Silver, Crude Oil, Forex, U.S. Stocks, and major global indices.
Trading volume is calculated using the combined value of buy and sell transactions, with larger volumes improving leaderboard rankings. New users can unlock additional rewards after completing their first qualifying CFD trade, while VIP participants gain access to exclusive competitions and higher reward opportunities. Reward distribution follows the campaign schedule published by Gate, with some prizes requiring manual claiming after winning.
Gold Market Context
Gold remains one of the world's most actively traded safe-haven assets.
As of 29 June 2026, spot gold is trading around the $4,090–4,110 per ounce region after rebounding from recent lows near $4,000. Price action continues to be influenced by persistent inflation, elevated Treasury yields, Federal Reserve policy expectations, and ongoing geopolitical uncertainty. Volatility has increased significantly, creating more short-term trading opportunities for CFD participants who actively monitor technical and macroeconomic developments.
Benefits for Traders
Gold CFDs provide several advantages for active traders.
Unlike traditional gold ownership, CFDs allow market participants to profit from both rising and falling prices while avoiding physical storage costs. Flexible leverage enables efficient capital utilization, and access to global markets through a single trading account simplifies portfolio diversification. Gold also maintains relatively deep liquidity during major trading sessions, making it attractive for short-term traders seeking tactical opportunities around economic news releases.
For many traders, Gold CFDs have become an effective way to diversify beyond cryptocurrencies while remaining within a familiar digital trading ecosystem.
Risk Management
Despite their flexibility, CFDs carry substantial risk.
Leverage amplifies both gains and losses, making effective risk management essential. Traders should carefully monitor margin requirements, maintain disciplined position sizing, and utilize stop-loss and take-profit orders to manage downside exposure. High market volatility around inflation reports, central bank decisions, and geopolitical developments can generate rapid price movements capable of triggering liquidation if positions are overleveraged.
Responsible trading, disciplined risk management, and continuous market research remain far more important than pursuing maximum leverage.
Bottom Line
The #TradFiCFDGoldMasters campaign combines competitive trading with one of the world's most actively traded financial assets.
Supported by a reward pool of up to 500,000 USDT, 1,020 grams of gold, multiple leaderboard competitions, and growing interest in TradFi CFDs, the campaign offers experienced traders an opportunity to participate in global financial markets while competing for promotional rewards.
However, CFD trading involves significant financial risk. Participants should fully understand leverage, margin requirements, and campaign rules before taking part.
@Gate_Square
repost-content-media
  • Reward
  • Comment
  • Repost
  • Share
#IranUSConflictEscalates
The Iran-US conflict entered its most volatile phase since the February 28 commencement of joint US-Israeli military operations, with a dramatic escalation followed by an immediate de-escalation in the final days of June 2026. The trigger came when Iran shot down a US drone near the Strait of Hormuz, prompting the US to launch retaliatory strikes on Iranian missile and drone storage facilities and radar sites along the southern coastline. Iran then attacked military and civilian targets in Bahrain and Kuwait, including a commercial ship transiting the Strait, in what
SPX5000.55%
NAS1000.75%
BTC0.03%
Falcon_Official
#IranUSConflictEscalates
Latest Trigger
The #IranUSConflictEscalates surged on June 29, 2026, after a fresh round of military exchanges threatened to derail the fragile ceasefire reached earlier this month. The latest escalation followed reported Iranian missile and drone attacks targeting U.S. military facilities in Bahrain and Kuwait, which Tehran described as retaliation for U.S. strikes on Iranian military infrastructure after an attack on commercial shipping near the Strait of Hormuz. Hours later, reports emerged that both governments had agreed to temporarily halt further attacks and resume diplomatic negotiations.
Timeline of Recent Events
Tensions increased after a commercial vessel operating near the Strait of Hormuz was struck, prompting U.S. airstrikes against Iranian military targets. Iran subsequently launched retaliatory missile and drone attacks against U.S. positions in Bahrain and Kuwait, with both governments accusing the other of violating the June 17 interim ceasefire. By late June 29, U.S. officials confirmed that both sides had agreed to suspend further military action while technical negotiations continue ahead of planned talks in Doha, Qatar.
Official Responses
U.S. officials stated that both countries had agreed to "stand down" to allow commercial shipping through the Strait of Hormuz while diplomatic discussions resume. Iranian Foreign Minister Abbas Araghchi reiterated Iran's position regarding sovereignty over the Strait and warned against actions that could undermine the existing memorandum of understanding. Both governments continue to present differing interpretations of recent events, highlighting that negotiations remain fragile despite the temporary pause in hostilities.
Global Market Impact
Financial markets reacted cautiously as geopolitical uncertainty returned.
Brent crude oil recovered above $72 per barrel, while U.S. WTI traded above $70, reflecting concerns over potential supply disruptions. Asian equity markets opened mixed, investors shifted toward defensive positioning, and volatility remained elevated. Gold initially benefited from safe-haven demand, although broader monetary policy expectations continued limiting upside momentum. Investor sentiment remains sensitive to every new development in the Gulf region.
Regional Impact
The Strait of Hormuz remains one of the world's most strategically important energy corridors, transporting a significant share of global oil exports.
Any disruption to shipping through the waterway immediately affects energy markets, insurance costs, freight rates, and regional security planning. Gulf states continue urging restraint while monitoring maritime security, as commercial vessel traffic remains central to global energy supply chains. Although shipping continues following the latest diplomatic understanding, the situation remains highly sensitive.
Crypto Market Reaction
Cryptocurrency markets also reflected growing geopolitical uncertainty.
Bitcoin continued trading near the important $60,000 support region, while Ethereum and most major digital assets experienced elevated volatility. Investors generally reduced exposure to higher-risk assets as uncertainty surrounding inflation, interest-rate expectations, and geopolitical developments weighed on overall market confidence. Although crypto has occasionally been viewed as an alternative asset during periods of instability, recent trading has remained closely linked to broader global risk sentiment.
Diplomatic Developments
Despite renewed military exchanges, diplomatic channels remain active.
According to U.S. officials, both governments have agreed to halt additional strikes temporarily and continue negotiations in Doha aimed at preserving the June memorandum and ensuring freedom of navigation through the Strait of Hormuz. While this represents an important step toward de-escalation, officials continue emphasizing that negotiations remain ongoing and that lasting stability will depend on future agreements.
Balanced Conclusion
The latest developments demonstrate how rapidly geopolitical tensions can influence global financial markets, energy prices, regional security, and investor confidence.
Although both Washington and Tehran have announced a temporary pause in military operations while diplomatic talks resume, the situation remains fluid and subject to change.
For investors, businesses, and policymakers alike, continued monitoring of official announcements remains essential as developments unfold.
@Gate_Square
repost-content-media
  • Reward
  • Comment
  • Repost
  • Share
#USMayPCEInflationRisesTo4.1%HighestIn3Years
The Federal Reserve faces its most challenging inflation moment in three years as the Personal Consumption Expenditures price index, the central bank's preferred inflation gauge, surged to 4.1% year-over-year in May 2026, up from 3.8% in April. This marks the highest headline PCE reading since April 2023 and represents a decisive acceleration that pushes inflation further above the Fed's 2% target. The Bureau of Economic Analysis confirmed that the monthly PCE increase was 0.4%, matching expectations, while personal income rose 0.7%, well above the
GAS8.18%
BTC0.03%
Falcon_Official
PCE Inflation Data
The #USMayPCEInflationRisesTo4.1%HighestIn3Years is trending after the U.S. Bureau of Economic Analysis released its latest Personal Consumption Expenditures (PCE) report on June 25, 2026. The Federal Reserve's preferred inflation gauge showed headline PCE inflation rising to 4.1% year-over-year in May, up from 3.8% in April and marking the highest annual reading since April 2023. On a monthly basis, headline PCE increased 0.4%, while core PCE, which excludes food and energy, rose 0.3% month-over-month and 3.4% year-over-year, compared with 3.3% in April. The report confirms that inflationary pressures remain well above the Federal Reserve's long-term 2% target.
Key Inflation Drivers
Several categories contributed to the stronger inflation reading.
Energy prices remained one of the largest drivers following earlier disruptions in global oil markets, while services inflation continued accelerating through higher housing, healthcare, insurance, transportation, and labor costs. AI-related demand also contributed to higher prices for semiconductor and technology products, while food inflation remained relatively modest compared with previous months. Wage growth and resilient consumer spending continued supporting overall price pressures across the broader economy.
Federal Reserve Outlook
The latest PCE data has significantly influenced expectations for Federal Reserve policy.
With inflation reaching a three-year high, financial markets have largely shifted away from expecting near-term interest-rate cuts. Instead, many economists now believe the Fed could maintain restrictive monetary policy for longer, while some analysts even consider the possibility of additional rate hikes if inflation remains persistent during the second half of 2026. Policymakers continue emphasizing that restoring price stability remains their primary objective before considering any meaningful easing cycle.
Market Reaction
Financial markets reacted cautiously following the inflation report.
The U.S. Dollar Index (DXY) remained supported near multi-month highs as higher interest-rate expectations strengthened demand for the dollar. Treasury yields stayed elevated, while equity markets experienced mixed performance as investors reassessed corporate valuations under a higher-rate environment.
Gold remained under pressure from the stronger dollar, while Bitcoin and the broader cryptocurrency market traded with elevated volatility as risk appetite weakened. Although consumer spending remained resilient, markets continue balancing economic strength against the possibility of tighter monetary policy.
Economic Significance
A 4.1% PCE inflation reading carries important implications for the U.S. economy.
It signals that inflation remains considerably above the Federal Reserve's target despite previous tightening measures. At the same time, the report showed personal income increasing 0.7%, consumer spending rising 0.7%, and real consumer spending advancing 0.3%, indicating that household demand remains relatively resilient even as borrowing costs stay elevated.
Strong consumer activity continues supporting economic growth, but it also increases the challenge of bringing inflation back toward target levels without slowing the broader economy too aggressively.
Analyst Perspective
Many economists believe inflation could gradually moderate later this year if energy prices continue stabilizing and supply-chain conditions improve.
However, persistent services inflation, resilient labor markets, and continued wage growth suggest that underlying inflation pressures may remain sticky. As a result, analysts generally expect the Federal Reserve to maintain a cautious policy stance until clearer evidence of sustained disinflation emerges.
Risks & Outlook
Looking ahead, inflation remains one of the most important variables influencing financial markets.
Higher borrowing costs could continue affecting consumer credit, mortgage demand, business investment, and corporate financing conditions. Investors will closely monitor upcoming inflation reports, labor-market data, and future Federal Reserve meetings for additional guidance on interest-rate policy.
While the U.S. economy continues demonstrating resilience, persistent inflation above target means volatility across equities, bonds, commodities, and digital assets is likely to remain elevated throughout the coming months.
Bottom Line
The latest 4.1% May PCE inflation reading represents the highest level in three years and reinforces the view that inflation remains the Federal Reserve's biggest economic challenge.
Strong consumer spending, resilient labor markets, and persistent services inflation continue supporting economic growth, but they also reduce the likelihood of near-term policy easing. For investors, the report highlights the importance of monitoring inflation trends, interest-rate expectations, and macroeconomic developments as they continue shaping global financial markets.
#USMayPCEInflationRisesTo4.1HighestIn3Years
@Gate_Square
repost-content-media
  • Reward
  • Comment
  • Repost
  • Share
#USNetCapitalInflowsHitRecord884B
The United States is experiencing an unprecedented surge in foreign investment that is reshaping the global capital flow landscape. According to the latest Treasury Department TIC data release for April 2026, net capital inflows into the US reached a staggering record of $884 billion over the 12 months ending April 2026, nearly tripling since the beginning of 2025. This figure dwarfs the previous peak of approximately $400 billion recorded in 2021, meaning the current inflow level is more than double what was considered extraordinary just a few years ago.
Pri
  • Reward
  • Comment
  • Repost
  • Share
#Get2SharesOfSKHynixAtZeroCost
The Specialist Paradox: Why the Niche Player Just Dethroned the Dynasty
Twenty years ago, SK Hynix was drowning in debt, one step from collapse. On June 22, 2026, it surpassed Samsung Electronics to become South Korea's most valuable listed company, with a market cap of 208.25 trillion won ($1.35 trillion) and shares up over 340% this year. How does a near-bankrupt memory chipmaker flip the script on a conglomerate worth ten times more? Welcome to the Specialist Paradox -- my framework for understanding why deep specialization beats broad dominance in the AI era
DragonFlyOfficial
#Get2SharesOfSKHynixAtZeroCost
The Specialist Paradox: Why the Niche Player Just Dethroned the Dynasty
Twenty years ago, SK Hynix was drowning in debt, one step from collapse. On June 22, 2026, it surpassed Samsung Electronics to become South Korea's most valuable listed company, with a market cap of 208.25 trillion won ($1.35 trillion) and shares up over 340% this year. How does a near-bankrupt memory chipmaker flip the script on a conglomerate worth ten times more? Welcome to the Specialist Paradox -- my framework for understanding why deep specialization beats broad dominance in the AI era.
Samsung was the undisputed king of Korea for 25 years. It made everything: phones, TVs, washing machines, memory chips, foundries. It was the ultimate generalist. SK Hynix did one thing obsessively -- high-bandwidth memory, or HBM. When Nvidia and Google needed memory chips that could keep pace with AI processors pushing trillions of calculations per second, only SK Hynix had the product ready. They command 61% of the global HBM market. Samsung holds 17%. Micron holds 21%. The Specialist Paradox says this: in a technological inflection, the company that bets everything on the one bottleneck everyone else ignored captures disproportionate value. SK Hynix saw HBM as the bottleneck before the market did. Samsung saw HBM as a secondary product line. The market punished that decision.
But here is where cognitive bias enters. Most investors are trapped in Anchoring Bias -- they anchor to Samsung's historical dominance and assume it will inevitably reclaim the crown. They also suffer from Status Quo Bias, treating Samsung's 25-year reign as permanent rather than circumstantial. These biases make people underestimate the structural shift happening right now: AI data centers will consume 70% of all memory chip production in 2026. That is not a cyclical bump. That is a permanent reordering of demand. HBM supply is structurally constrained for years ahead. Micron just reported that customers committed $22 billion to lock in supply. SK Hynix's own Nasdaq ADR listing -- targeted for July 10, raising up to $29.4 billion, the second-largest global listing after SpaceX -- signals that the capital markets are re-rating this company from a Korean small-cap story to a global AI infrastructure asset. When it lists on Nasdaq, U.S. institutional investors who could not buy Korean-listed shares will enter. That demand shock alone could tighten the valuation gap further.
The bullish case is straightforward. HBM demand outstrips supply by a widening margin. SK Hynix's production is locked into multiyear contracts with Nvidia and other hyperscalers. Revenue doubled in 2025. Operating profit surged 137%. The Nasdaq listing unlocks a new investor base and potential index inclusion. LPDDR demand from Nvidia's next-generation Vera Rubin platform could tighten the broader memory market from 2027, giving SK Hynix pricing power across its entire portfolio, not just HBM.
The bearish case deserves equal weight. A 340% YTD rally embeds enormous expectations. Any miss on HBM volume or pricing would punish the stock violently. Samsung is investing aggressively to close the HBM gap. If Samsung's next-gen HBM4 achieves parity, SK Hynix's 61% market share erodes. The $29.4 billion Nasdaq listing dilutes existing shareholders -- 17.79 million new shares are being issued. That is not a free lunch. Furthermore, geopolitical risk surrounds Korea: trade policy shifts, export controls on semiconductor equipment, and regional instability all present tail risk that no analysis can price accurately.
Key risk: the Specialist Paradox has a flip side. Specialization magnifies upside during a demand supercycle, but it also magnifies downside if that demand normalizes. If AI capex slows -- if data center buildout decelerates even modestly -- HBM pricing collapses faster than a generalist's diversified portfolio. SK Hynix has no phone business, no TV division, no foundry to cushion the fall. You are buying pure exposure to the AI memory bottleneck. That is either the most leveraged bet in global equities or the most dangerous one.
Critical levels to watch. SK Hynix on KRX (000660.KS): the June 22 breakout above Samsung's market cap was symbolic, but watch whether it holds above 2,080 trillion won in market cap consistently. If Samsung rallies back above, the narrative weakens. On the Nasdaq ADR listing, the pricing range and first-day trading will set the tone for re-rating. Entry consideration: post-listing volatility typically creates a window. Exit consideration: if HBM4 competitive data from Samsung shows significant market share capture, that is the signal to reassess.
Future outlook. The AI memory bottleneck will persist through at least 2028. SK Hynix is positioned as the primary toll collector on that bottleneck. The Nasdaq listing transforms it from a Korea-only story into a global benchmark stock. But every supercycle ends. The question is not whether SK Hynix is the winner today -- it clearly is. The question is whether you can exit before the cycle turns, because specialization has no floor when demand reverses.
Now the practical angle. Gate has launched Korean stock trading. You can trade SK Hynix and 1,000+ KRX-listed stocks directly with USDT -- no Korean brokerage account needed, no won conversion required. Fractional shares from 0.01. And right now, there is a campaign running through June 30: trade stocks and receive SK Hynix fractional share airdrops. For every 10,000 USDT cumulative trading volume, you get random SK Hynix airdrops from 0.01 to 0.5 shares. Maximum per user: 2 full shares of SK Hynix, approximately 3,400 USDT at current prices. First-time SK Hynix traders also get 5-17 USDT equivalent in SK Hynix rewards. That is the Get2SharesOfSKHynixAtZeroCost play -- trade volume earns you SK Hynix shares as airdrop, on top of whatever the stock itself does.
This is not investment advice. SK Hynix at a 340% rally is a high-risk position. The Specialist Paradox explains why it won, and why it could lose. Trade with conviction, but always with a plan to leave before the crowd realizes the cycle has turned.
repost-content-media
  • Reward
  • 2
  • Repost
  • Share
ShainingMoon:
To The Moon 🌕
View More
#GTToken
$GT
GateToken (GT): My 2026 Market Prediction, Analysis & Long-Term Outlook
GateToken (GT) has matured far beyond the role of a traditional exchange token. In today's market, it represents the foundation of an expanding blockchain ecosystem where exchange services, Layer-1 infrastructure, staking, Web3 applications, token launches, and payment utilities all converge around a single digital asset. As of 28 June 2026, GT continues to attract attention from investors looking for projects backed by real utility instead of short-term speculation.
Current Market Perspective
GT is curren
GT-1.21%
BTC0.03%
Yusfirah
#GTToken
$GT
GateToken (GT): My 2026 Market Prediction, Analysis & Long-Term Outlook
GateToken (GT) has matured far beyond the role of a traditional exchange token. In today's market, it represents the foundation of an expanding blockchain ecosystem where exchange services, Layer-1 infrastructure, staking, Web3 applications, token launches, and payment utilities all converge around a single digital asset. As of 28 June 2026, GT continues to attract attention from investors looking for projects backed by real utility instead of short-term speculation.
Current Market Perspective
GT is currently trading around the mid-$6 range after experiencing a significant correction from its previous cycle high above $25. While some traders view this decline as weakness, I see it differently. Markets move in cycles, and historically, strong utility tokens often spend months building accumulation zones before beginning a new expansion phase.
Unlike many tokens that depend solely on hype, GT benefits from continuous ecosystem activity. Every new user joining the platform, every Launchpad event, every staking participant, and every transaction on Gate Layer contributes to long-term demand for the token.
Why I Believe GT Still Has Strong Potential
One factor that continues to impress me is GT's deflationary model. A large portion of the original supply has already been permanently removed through scheduled token burns, making GT increasingly scarce over time. When supply consistently decreases while ecosystem usage expands, long-term price pressure can gradually shift in favor of holders.
Another reason for optimism is the rapid growth of Gate Layer. GT is no longer limited to exchange discounts—it now serves as the native gas token for blockchain transactions. As more decentralized applications, developers, and users adopt the network, GT's role within the ecosystem becomes increasingly important.
Technical Structure
From a technical perspective, GT appears to be trading inside a long-term consolidation range rather than a confirmed bearish trend.
Key support levels I am watching include:
- $6.20–$6.00 (primary demand zone)
- $5.70
- $5.30
- $5.00 (major long-term support)
If buyers continue defending these levels, they could provide the foundation for the next upward movement.
On the upside, several resistance levels remain important:
- $7.00
- $8.00
- $9.50
- $12.00
- $15.00
- $18.00
- $20.00
- Previous ATH near $25.38
A strong breakout above the $8 region would likely improve market sentiment significantly and could attract additional momentum traders.
My Prediction
Looking ahead, I believe GT has the potential to outperform many exchange tokens if three conditions continue to develop:
• Continued expansion of the Gate ecosystem
• Regular quarterly token burns reducing circulating supply
• Increased activity on Gate Layer and Web3 applications
If the overall cryptocurrency market enters another bullish phase over the coming quarters, I believe GT could realistically revisit $10–12 as an initial recovery target. Sustained ecosystem growth may later support moves toward $15–20, while reclaiming the previous all-time high around $25 would likely require both strong market conditions and continued platform expansion.
If adoption accelerates beyond current expectations and institutional participation grows, GT could eventually enter a new price-discovery phase above its previous record over the next major market cycle. However, that scenario would depend on sustained user growth, higher blockchain activity, and favorable crypto market sentiment.
My Trading Approach
Personally, I would avoid chasing sharp rallies. Instead, I prefer gradually accumulating during periods of market fear and uncertainty. Dollar-cost averaging helps reduce the impact of volatility while allowing investors to build positions over time rather than relying on perfect market timing.
For shorter-term traders, risk management remains essential because Bitcoin dominance, macroeconomic news, and regulatory developments can influence the entire crypto market, including GT.
Final Thoughts
In my opinion, GT is no longer just an exchange utility token—it has evolved into a comprehensive ecosystem asset backed by blockchain infrastructure, staking, Launchpad participation, Web3 integration, payment use cases, and a deflationary economic model.
While short-term price fluctuations are inevitable, the long-term fundamentals continue to strengthen. If Gate maintains its pace of innovation, expands globally, attracts more developers to Gate Layer, and continues reducing token supply through regular burns, GT could become one of the stronger-performing ecosystem tokens during the next major crypto expansion.
For investors with a long-term perspective, patience and disciplined accumulation may prove more valuable than reacting to daily market volatility. In crypto, the projects with sustainable utility, active development, and growing ecosystems have historically delivered the strongest performance over full market cycles.
repost-content-media
  • Reward
  • 2
  • Repost
  • Share
ShainingMoon:
To The Moon 🌕
View More
#ETHPrediction
$ETH
Ethereum (ETH) is approaching one of its most important technical phases of 2026. After months of volatility, the market is watching whether ETH can reclaim key resistance levels and restore bullish momentum. Current sentiment remains cautious because of macroeconomic uncertainty, ETF flow weakness, reduced risk appetite, and slower capital rotation, but Ethereum's ecosystem continues to demonstrate long-term strength through Layer-2 expansion, staking growth, and continued smart contract adoption.
My prediction for the coming days:
If ETH holds above its major support
ETH0.17%
BTC0.03%
Yusfirah
#ETHPrediction
$ETH
Ethereum (ETH) is approaching one of its most important technical phases of 2026. After months of volatility, the market is watching whether ETH can reclaim key resistance levels and restore bullish momentum. Current sentiment remains cautious because of macroeconomic uncertainty, ETF flow weakness, reduced risk appetite, and slower capital rotation, but Ethereum's ecosystem continues to demonstrate long-term strength through Layer-2 expansion, staking growth, and continued smart contract adoption.
My prediction for the coming days:
If ETH holds above its major support zone and buying volume continues to strengthen, a recovery toward the $1,900–$2,100 range is achievable. A decisive breakout above $2,100–$2,250 could signal the beginning of a stronger bullish trend and attract renewed institutional and retail participation.
On the downside, if key support levels fail to hold, ETH could revisit the $1,400–$1,500 region before establishing a stronger foundation for its next upward cycle. This would likely create another period of accumulation before momentum returns.
From my market perspective, Ethereum remains one of the strongest blockchain ecosystems for long-term growth despite ongoing short-term volatility. Network development continues to expand, staking participation remains significant, and the broader ecosystem continues to attract builders and developers. These fundamentals strengthen Ethereum's long-term outlook even when market sentiment weakens.
Based on my experience, patience and disciplined risk management often produce better results than reacting emotionally to short-term price swings. The next major move will likely depend on Bitcoin's direction, overall market liquidity, and improving investor confidence. Until then, focusing on confirmation through higher highs, stronger trading volume, and sustained momentum remains the most balanced approach.
repost-content-media
  • Reward
  • Comment
  • Repost
  • Share
#BTCMarketRebound
$BTC
Bitcoin has entered a recovery phase after experiencing intense selling pressure earlier in the week, with buyers stepping back into the market and helping stabilize price action around a critical support region. The rebound has improved overall market sentiment, but volatility remains elevated as traders continue evaluating whether this move represents the beginning of a sustainable recovery or simply a temporary relief rally before the next major trend develops. The coming days will be crucial in determining whether Bitcoin can build enough momentum to reclaim high
BTC0.03%
Yusfirah
#BTCMarketRebound
$BTC
Bitcoin has entered a recovery phase after experiencing intense selling pressure earlier in the week, with buyers stepping back into the market and helping stabilize price action around a critical support region. The rebound has improved overall market sentiment, but volatility remains elevated as traders continue evaluating whether this move represents the beginning of a sustainable recovery or simply a temporary relief rally before the next major trend develops. The coming days will be crucial in determining whether Bitcoin can build enough momentum to reclaim higher resistance levels and restore broader market confidence.
One of the primary drivers behind today's rebound is the gradual return of buying interest after the recent wave of liquidation across the cryptocurrency market. During the correction, excessive leverage was flushed out, forcing many overextended positions to close. Historically, these large-scale liquidations help reset market conditions by removing speculative positions and allowing healthier price discovery. As leverage declines, the market often becomes more stable, creating opportunities for long-term investors to accumulate while reducing the risk of another immediate cascade of forced selling.
Institutional activity continues to play a significant role in Bitcoin's direction. Although recent sessions witnessed weaker capital inflows and cautious positioning from large investors, today's recovery suggests that confidence may slowly be returning. Professional investors typically wait for clear confirmation before increasing exposure, making trading volume, spot market demand, and sustained buying pressure important indicators to monitor over the next several sessions. If institutional participation strengthens, Bitcoin could regain momentum much faster than many expect.
Market structure has also improved compared to the sharp decline seen during the correction. Buyers successfully defended an important support zone, preventing further panic selling and allowing confidence to gradually return. Higher trading activity combined with improving market sentiment often creates the foundation for stronger price movements. However, confirmation remains essential. A single green day does not establish a new bullish trend. Consecutive daily closes above key resistance levels, increasing spot demand, and expanding trading volume would provide much stronger evidence that the recovery is becoming sustainable.
The broader macroeconomic environment continues to influence digital asset markets. Investors remain focused on inflation expectations, monetary policy, interest rate outlooks, global liquidity, and geopolitical developments. Any improvement in these factors could encourage renewed investment into higher-risk assets, including cryptocurrencies. Conversely, unexpected economic uncertainty could slow Bitcoin's recovery and increase short-term volatility. This connection between traditional financial markets and digital assets remains stronger than ever, making macroeconomic developments an essential part of every trader's analysis.
On-chain indicators continue to present an encouraging long-term picture despite recent price weakness. Long-term holders have generally maintained their positions rather than selling into fear, while exchange balances remain relatively controlled compared to previous market cycles. These conditions often suggest that stronger hands continue accumulating during periods of uncertainty instead of exiting the market. Historically, similar behavior has frequently preceded the next stage of long-term price appreciation once market confidence returns.
Bitcoin's dominance within the cryptocurrency market also remains elevated, indicating that investors continue viewing Bitcoin as the primary defensive asset during uncertain conditions. Capital has remained more concentrated in Bitcoin while many alternative cryptocurrencies have experienced greater volatility. If Bitcoin successfully extends its recovery, improved confidence could eventually spread throughout the broader digital asset market, supporting stronger performance across multiple sectors.
From my market perspective, today's rebound is an encouraging signal, but patience remains essential. Financial markets rarely move in a straight line after major corrections. Sustainable bull markets are built through gradual accumulation, improving investor confidence, increasing liquidity, and consistent higher highs. Reacting emotionally to short-term volatility often leads to poor decisions, while disciplined risk management and confirmation-based strategies typically produce stronger long-term results.
My prediction for the coming days: If Bitcoin continues holding above its current support while buying volume expands, a recovery toward the $63,000–$65,000 range appears achievable. Breaking above this region with strong momentum could attract additional institutional participation and potentially push Bitcoin toward the $67,000–$70,000 area in the following weeks. However, if sellers regain control and key support fails, Bitcoin could revisit the $58,000–$59,000 zone before establishing a stronger accumulation base. Overall, the market appears to be transitioning from fear toward cautious optimism, and the next several trading sessions will likely determine whether this rebound develops into the next significant bullish phase or remains a temporary recovery within a broader consolidation period.
repost-content-media
  • Reward
  • Comment
  • Repost
  • Share
#BTCProbes60KKeySupportLevel
Bitcoin has entered another critical phase as it tests the $60,000 support level, a price zone that many traders consider one of the most important psychological and technical areas of the current market cycle. Whenever Bitcoin approaches a major support level, market participants closely monitor price action to determine whether buyers have enough strength to defend the trend or whether sellers will gain control and push prices lower.
Support levels represent areas where buying interest has historically been strong enough to slow or reverse downward momentum. The
BTC0.03%
EagleEye
#BTCProbes60KKeySupportLevel
Bitcoin has entered another critical phase as it tests the $60,000 support level, a price zone that many traders consider one of the most important psychological and technical areas of the current market cycle. Whenever Bitcoin approaches a major support level, market participants closely monitor price action to determine whether buyers have enough strength to defend the trend or whether sellers will gain control and push prices lower.
Support levels represent areas where buying interest has historically been strong enough to slow or reverse downward momentum. The $60,000 level carries additional significance because it combines psychological importance with technical relevance. Large round numbers often attract increased trading activity, making them key battlegrounds between bulls and bears.
For bullish investors, holding above this level would reinforce confidence that the broader uptrend remains intact. Strong buying volume near support may indicate that long-term investors continue viewing temporary pullbacks as opportunities rather than reasons for concern. A successful defense of this level could encourage renewed momentum toward higher resistance zones if market sentiment improves.
On the other hand, if selling pressure becomes stronger and Bitcoin closes decisively below this support, traders may begin focusing on lower technical levels for potential stabilization. Market participants often reassess risk during these moments, making disciplined strategy and proper position management especially important.
Market sentiment remains one of the strongest short-term drivers of Bitcoin price action. Positive institutional developments, growing adoption, favorable macroeconomic conditions, or increased demand from long-term holders can strengthen confidence. Conversely, uncertainty surrounding monetary policy, regulatory developments, or broader financial market weakness may increase short-term volatility.
Institutional participation continues to play a larger role in Bitcoin's market structure. Professional investors, asset managers, and corporations have significantly increased their presence in recent years, bringing greater liquidity while also making Bitcoin more responsive to broader macroeconomic trends. Interest rate expectations, inflation data, and central bank decisions now influence cryptocurrency markets more than ever before.
Technical analysts are watching several indicators beyond price alone. Trading volume, momentum oscillators, moving averages, and market structure all provide additional clues about the strength of current price action. A support level becomes more meaningful when accompanied by increasing buying volume and improving momentum, while weak volume during a bounce may signal that buyers remain cautious.
Volatility is a natural characteristic of Bitcoin. Sharp price swings have accompanied nearly every major phase of its history. Experienced market participants understand that temporary corrections are part of long-term market cycles, making emotional discipline one of the most valuable qualities for both traders and investors.
Risk management becomes especially important when markets approach major support zones. Defining position size, maintaining appropriate diversification, and avoiding emotional decisions can help investors navigate periods of heightened uncertainty. Successful market participants often focus less on predicting every price movement and more on managing risk effectively.
Beyond short-term price action, Bitcoin's long-term investment narrative remains centered around limited supply, growing institutional adoption, expanding global awareness, and increasing integration into the broader financial system. These structural themes continue attracting attention from investors who view digital assets as an evolving part of modern finance.
Blockchain innovation also continues expanding beyond simple value transfer. Developments in financial infrastructure, payment solutions, tokenization, and decentralized technologies demonstrate how the broader digital asset ecosystem continues to mature. Bitcoin remains the largest and most recognized cryptocurrency, often serving as the benchmark for overall market sentiment.
Macroeconomic conditions remain an important influence. Inflation expectations, employment reports, interest rate decisions, and global liquidity conditions all shape investor appetite for both traditional and digital assets. When economic uncertainty increases, cryptocurrencies may experience periods of heightened volatility as investors adjust their portfolios.
Psychology plays a significant role during major support tests. Fear often increases when prices approach critical levels, while optimism returns quickly if support holds and buyers regain momentum. Understanding market psychology can help investors avoid making impulsive decisions driven solely by short-term price fluctuations.
Every market cycle presents opportunities for learning. Some participants focus on short-term trading strategies, while others emphasize long-term accumulation and portfolio management. Regardless of strategy, maintaining discipline, conducting thorough research, and respecting market risk remain essential principles.
The coming trading sessions may provide greater clarity regarding Bitcoin's next major direction. If buyers successfully defend the $60,000 support level, confidence could gradually return and encourage another attempt toward higher resistance levels. If selling pressure continues to dominate, traders may look for the next significant support zone before expecting a stronger recovery.
Markets rarely move in straight lines. Corrections, consolidations, and periods of uncertainty are natural components of long-term trends. Investors who remain focused on research, disciplined risk management, and thoughtful decision-making are often better positioned to navigate changing market conditions.
Bitcoin's test of the $60,000 support level is more than a technical event—it reflects the ongoing balance between optimism and caution across the cryptocurrency market. Whether this level becomes the foundation for the next upward move or gives way to additional volatility, it will remain a closely watched milestone for traders and investors around the world as they evaluate the next chapter of Bitcoin's evolving market journey.
repost-content-media
  • Reward
  • Comment
  • Repost
  • Share
#WorldCup🇧🇷vs🇯🇵
The FIFA World Cup 2026 Round of 32 presents one of the most exciting knockout fixtures as Brazil faces Japan. Both teams earned their place in the knockout stage after impressive performances during the group phase, but now every match is win-or-go-home. With a place in the Round of 16 at stake, expect an intense tactical battle between two technically gifted sides.
Match Details
Competition: FIFA World Cup 2026
Round: Round of 32
Date: 29 June 2026
Venue: Hard Rock Stadium, Miami Gardens, Florida
Kick-off: 3:00 PM ET
Head-to-Head Record
Total Meetings: 13
Brazil Wins: 11
BRA VS JPN
Brazil
1.72x
58%
Draw
3.85x
26%
Japan
5.56x
18%
$3.69M Vol
Falcon_Official
#WorldCup🇧🇷vs🇯🇵
World Cup 2026 Round of 32: Brazil vs Japan Tactical Preview and Prediction
The Stage Is Set: A Clash of Football Philosophies
The knockout phase of the 2026 FIFA World Cup kicks off on June 29 at NRG Stadium in Houston, and one of the most compelling Round of 32 matchups pits five-time champions Brazil against a Japan side that has once again proven it belongs on the world stage.
This is not just a football match it is a collision of contrasting philosophies, a test of whether tactical discipline can overcome raw individual brilliance, and a moment that could define the trajectory of both nations at this tournament.
Brazil: The Selecao Find Their Rhythm
Brazil arrived at this World Cup under coach Carlo Ancelotti with one mission: end a 24-year wait for a sixth star.
Their group stage campaign in Group C was steady if unspectacular at first a frustrating 1-1 draw with Morocco in the opener raised questions about whether Ancelotti's system could click quickly enough.
But the response was emphatic.
A 3-0 demolition of Haiti followed, and then a clinical 3-0 victory over Scotland in Miami sealed top spot with seven points and a plus-six goal difference.
Brazil conceded only once across three matches that lone Moroccan goal in the first game making their defensive record one of the stingiest in the entire group stage.
The story of Brazil's campaign so far is Vinicius Junior.
The Real Madrid star has scored in every single group match, tallying four goals to sit alongside Erling Haaland and Kylian Mbappe in the Golden Boot chase, one behind Lionel Messi's five.
His brace against Scotland a seventh-minute opener and a clinical finish just before halftime showcased the devastating pace and finishing that make him the most dangerous attacker in this tournament.
Ancelotti is expected to deploy a 4-2-3-1 formation with Vinicius as the primary weapon on the left flank, supported by Matheus Cunha and Brahim Diaz in the attacking midfield roles.
However, Brazil will be without Barcelona forward Raphinha, who sustained a hamstring injury during the Haiti match on June 19 and has not played since.
Raphinha's absence deprives Brazil of their most creative right-sided outlet, forcing Ancelotti to adjust his wide attacking balance.
The likely replacement is Rayan, who will step into the right channel.
Neymar, recovering from a calf issue, has returned to training but is expected to start on the bench a calculated gamble by Ancelotti to preserve his most iconic player for deeper knockout rounds rather than risk him in a match Brazil are favored to control.
Japan: The Samurai Blue's Quarter-Final Quest
Japan's path to Houston tells the story of a team that continues to evolve.
Drawn in Group F alongside the Netherlands, Sweden, and Tunisia, Hajime Moriyasu's side opened with an impressive 2-2 draw against the Dutch a result that signaled Japan could compete with European heavyweights.
A record-setting 4-0 thrashing of Tunisia followed, with Daichi Kamada and Ayase Ueda among the scorers in what was also the 1000th match in FIFA World Cup history.
They then held Sweden to a 1-1 draw to secure second place on five points.
Yet Japan's World Cup is shadowed by significant absences.
Brighton winger Kaoru Mitoma, whose electric performances against Germany and Spain in 2022 made him a symbol of Japan's potential, was ruled out before the tournament with a hamstring injury.
Monaco forward Takumi Minamino also missed the squad, and Takefusa Kubo arguably Japan's most gifted playmaker has reportedly been struggling with fitness issues throughout the preparation period.
Losing that caliber of talent would cripple most nations, but Japan's depth and tactical flexibility have compensated.
Moriyasu has built a system rooted in disciplined defending, rapid transitions, and collective movement that does not rely on any single individual.
Japan's historical World Cup knockout record, however, is their biggest psychological hurdle.
In four previous knockout appearances 2002, 2010, 2018, and 2022 they have never won a match.
The 2022 penalty shootout defeat to Croatia still stings.
This Round of 32 tie represents not just a chance to progress, but to shatter a pattern that has defined their tournament history.
Head-to-Head: A Dominant Brazilian Record
The historical ledger overwhelmingly favors Brazil.
Across all meetings, Brazil holds 11 wins, Japan has just one victory, and there have been two draws.
The lone Japanese win came in October 2025 a stunning 3-2 comeback in the Kirin Challenge Cup after Brazil blew a 2-0 lead.
That result, while impressive, came in a friendly setting and with a very different Brazilian lineup.
In competitive contexts, Brazil has been ruthless:
4-1 at the 2006 World Cup.
3-0 in the 2013 Confederations Cup.
Multiple commanding friendly victories.
Japan has never beaten Brazil in a competitive fixture.
Tactical Breakdown: Where the Match Will Be Won and Lost
Ancelotti's 4-2-3-1 gives Brazil a structured attacking platform.
The double pivot likely Ederson Silva and one of Bruno Guimaraes or Joelinton will aim to control tempo and protect the back four, which has been outstanding.
Eder Militao has publicly warned his teammates about Japan's threat, underscoring that Brazil are not taking this opponent lightly.
The key tactical battle will be Japan's low block and counter-press against Brazil's wide attacking play.
Without Raphinha, Brazil's right side may lack the same penetration, which could allow Japan to concentrate defensive resources toward Vinicius on the left.
Moriyasu will likely set up in a compact 4-2-3-1 or 4-4-2 shape, looking to absorb pressure and exploit transition moments.
Kamada's intelligence in the midfield, Ueda's directness in the center-forward role, and the energy of Kento Shiogai on the flanks represent Japan's most viable attacking outlets.
The Samurai Blue will need to be near-perfect in their defensive organization and clinical in their limited transition chances margins that are extraordinarily thin against a team with Brazil's firepower.
Prediction: Brazil 2-1 — But Not Without Drama
The consensus across major sports outlets, prediction markets, and expert analysts points toward a Brazil victory.
Yahoo Sports projects Brazil to win with over 2.5 goals.
BetUS offers Brazil vs Japan over 2.5 goals at +105.
Sporting News predicts a 2-1 Brazilian win — a scoreline that acknowledges Japan's capacity to score while recognizing Brazil's superiority in depth and star quality.
The 4/6 odds on a straight Brazil win reflect the legitimate gap between these sides.
My prediction aligns with that consensus: Brazil 2-1.
Vinicius will likely find the net again his tournament form makes that almost inevitable and Brazil's superior squad depth means they can adjust the game plan from the bench if needed.
But Japan will not be blanked.
Their organized counter-attacking and midfield craft should produce at least one goal, making this a contest rather than a rout.
There is also a plausible scenario where Japan's discipline forces a 1-1 draw through 90 minutes, sending the match to extra time but Brazil's fitness and depth would likely prevail in that scenario as well.
The alternative outcome Japan pulling off what would be their first-ever competitive win over Brazil would require a perfect performance: flawless defending, a lethal transition goal, and perhaps some fortune.
The 2025 Kirin Cup showed it is possible, but the intensity and stakes of a World Cup knockout match are a fundamentally different proposition.
Why This Match Matters Beyond the Result
This is the match that starts the knockout phase.
Houston will be loud, the stakes will be absolute, and the football world will be watching to see whether Brazil's march toward a sixth title continues or whether Japan finally breaks through their knockout ceiling.
My prediction:
Brazil 2-1.
Brazil 3-2.
#PredictWorldCupWin40000U
#PredictWorldCupShare20000U
@Gate_Square
repost-content-media
  • Reward
  • Comment
  • Repost
  • Share
#WorldCup🇿🇦vs🇨🇦
South Africa vs Canada: Round of 32 Knockout Showdown
The 2026 FIFA World Cup knockout stage kicks off with a historic encounter as South Africa faces Canada at SoFi Stadium in Los Angeles on June 29, 2026. Both nations have reached the Round of 32 for the first time in their World Cup histories, transforming this fixture into uncharted territory where neither side carries the burden of past knockout expectations.
Canada enters this match as the clear favorite, with market expectations reflecting their superior squad depth and attacking firepower. Co-hosts of the tournamen
RSA VS CAN
South Africa
No
Draw
No
Canada
Yes
$40.57M Vol
GateSquare
🇿🇦 South Africa vs Canada, the Round of 32 knockout match officially kicks off!
The World Cup enters the knockout stage as South Africa takes on host Canada. Win or go home, margin for error drops to zero. Do you see South Africa continuing its Cinderella run, or Canada advancing on home turf?
⏰ Match time: June 29, 2026, 03:00 (UTC+8)
👉 Participate in prediction: https://gate.onelink.me/Hls0/prediction?page=detail&event_ticker=632707&source=cex
Come to Gate Polymarket and predict this Round of 32 knockout match!
repost-content-media
  • Reward
  • Comment
  • Repost
  • Share
🇿🇦 South Africa vs Canada, the Round of 32 knockout match officially kicks off!
The World Cup enters the knockout stage as South Africa takes on host Canada. Win or go home, margin for error drops to zero. Do you see South Africa continuing its Cinderella run, or Canada advancing on home turf?
⏰ Match time: June 29, 2026, 03:00 (UTC+8)
👉 Participate in prediction: https://gate.onelink.me/Hls0/prediction?page=detail&event_ticker=632707&source=cex
Come to Gate Polymarket and predict this Round of 32 knockout match!
GateSquare
🇿🇦 South Africa vs Canada, the Round of 32 knockout match officially kicks off!
The World Cup enters the knockout stage as South Africa takes on host Canada. Win or go home, margin for error drops to zero. Do you see South Africa continuing its Cinderella run, or Canada advancing on home turf?
⏰ Match time: June 29, 2026, 03:00 (UTC+8)
👉 Participate in prediction: https://gate.onelink.me/Hls0/prediction?page=detail&event_ticker=632707&source=cex
Come to Gate Polymarket and predict this Round of 32 knockout match!
repost-content-media
  • Reward
  • Comment
  • Repost
  • Share
💰 $10,000 CFD card coupon awaits you! New users get 100% winning chance, right now!
Gate Square Growth Value 2️⃣0️⃣ Grand Carnival, prize pool increased, full of sincerity!
Draw directly 👉 https://www.gate.com/zh/activities/pointprize?now_period=20
Why must you participate?
1️⃣ Extremely low threshold: Browse posts, reply to comments, no trading needed to draw and earn points.
2️⃣ Guaranteed win: New and old friends complete tasks, 100% winning rate!
3️⃣ Powerful prizes: Prediction market experience coupons, financial management experience funds, fee rebate coupons, VIP upgrades awaiting you
BTC0.03%
ETH0.17%
SPCX2.61%
GateSquare
💰 $10,000 CFD card coupon awaits you! New users get 100% winning chance, right now!
Gate Square Growth Value 2️⃣0️⃣ Grand Carnival, prize pool increased, full of sincerity!
Draw directly 👉 https://www.gate.com/zh/activities/pointprize?now_period=20
Why must you participate?
1️⃣ Extremely low threshold: Browse posts, reply to comments, no trading needed to draw and earn points.
2️⃣ Guaranteed win: New and old friends complete tasks, 100% winning rate!
3️⃣ Powerful prizes: Prediction market experience coupons, financial management experience funds, fee rebate coupons, VIP upgrades awaiting you
Details: https://www.gate.com/announcements/article/100364
#BTC #ETH #SPCX
repost-content-media
  • Reward
  • Comment
  • Repost
  • Share
#MicronOvertakesMetaInMarketValue
Micron Surpasses Meta in Market Valization as AI Infrastructure Demand Accelerates
Micron Technology has achieved a remarkable milestone in the semiconductor industry, overtaking Meta Platforms in market capitalization and briefly surpassing Tesla to claim a valuation of $1.398 trillion. This achievement represents the culmination of a sustained rally driven by insatiable demand for high-bandwidth memory chips powering the artificial intelligence revolution.
The memory chipmaker's ascent has been nothing short of extraordinary. Micron's shares surged 18.4% to
SoominStar
#MicronEarningsBeatExpectationsSharesRise
ELON MUSK MAY HAVE JUST EXPOSED THE NEXT BIG PROBLEM FOR THE GLOBAL ECONOMY.
Musk says AI demand is now so extreme that production shortages have become “insane.”
At the same time, Tim Cook says tech cost inflation is the worst he has seen in 40 years.
Now AI is starting to push up the cost of chips, electricity, software, smartphones, and data centers across the entire economy.
The AI boom is no longer just a Bubble.
It is starting to become an inflation problem too
DYOR 👀
  • Reward
  • 4
  • Repost
  • Share
Yusfirah:
To The Moon 🌕
View More
#USMayPCEInflationRisesTo4.1%HighestIn3Years
U.S. May PCE Inflation Climbs to 4.1%, Marking Three-Year High
The Federal Reserve's preferred inflation gauge, the Personal Consumption Expenditures (PCE) price index, surged to 4.1% in May 2026, reaching its highest level in three years and intensifying concerns about persistent price pressures within the U.S. economy. This elevated reading has significant implications for monetary policy expectations and asset pricing across financial markets.
The May PCE data arrived in the immediate aftermath of the Federal Reserve's June meeting, where policy
Falcon_Official
#USMayPCEInflationRisesTo4.1%HighestIn3Years
The May 2026 U.S. PCE inflation report, released on June 25, delivered a major shock to financial markets and dealt a serious blow to expectations of a dovish Federal Reserve. The Personal Consumption Expenditures (PCE) Price Index surged 4.1% year-over-year, marking its highest reading since April 2023 and the first time inflation has crossed the 4% threshold in more than three years.
Meanwhile, Core PCE, which excludes food and energy, climbed to 3.4%, matching expectations but reaching its highest level since October 2023.
Inflation Trend
The recent inflation trajectory leaves little room for optimism.
PCE has accelerated consistently over the past four months:
February: 2.9%
March: 3.5%
April: 3.8%
May: 4.1%
This is no longer a temporary spike.
It represents sustained inflationary momentum that the Federal Reserve can no longer ignore.
What's Driving Inflation?
Several major factors continue pushing prices higher.
Energy markets remain under pressure as geopolitical tensions in the Middle East have driven gasoline prices upward.
At the same time, semiconductor prices continue rising as AI infrastructure demand creates severe supply bottlenecks across the global technology sector.
A clear example came this week when Apple increased prices on selected Mac and iPad models by approximately 6%, directly citing higher memory chip costs.
This is a textbook example of wholesale inflation flowing directly into consumer prices.
Market Reaction
Markets reacted immediately.
On June 26, Minneapolis Fed President Neel Kashkari stated that he now expects one Federal Reserve rate hike before the end of 2026, representing a meaningful shift from his earlier outlook.
Prediction markets have also adjusted sharply.
According to Polymarket, the "0 Rate Cuts" contract now trades around 79.5%, reflecting overwhelming market expectations that interest rates will remain unchanged—or potentially move even higher—throughout the year.
The conversation has shifted dramatically.
Markets are no longer asking:
"When will the Fed cut rates?"
Instead, investors are asking:
"Will the Fed hike rates again?"
Impact on Crypto Markets
The impact has been immediate across digital assets.
Bitcoin continues testing the critical $60,000 support level, recently falling to approximately $59,943 after several daily wicks below the June 5 low.
Although the Daily RSI has dropped into oversold territory near 24.95, oversold conditions alone do not guarantee a reversal.
At the same time:
Stablecoin dominance continues rising.
Risk-off sentiment remains elevated.
Approximately $600 million in crypto long positions were liquidated within a recent 24-hour period.
Broader Economic Picture
Traditional markets are experiencing similar pressure.
Mortgage rates continue climbing.
Consumer spending remains surprisingly resilient despite higher inflation, giving the Federal Reserve greater flexibility to maintain restrictive monetary policy without immediately triggering recession concerns.
Meanwhile:
The S&P 500 has surrendered significant recent gains.
The Nasdaq has fallen below its 50-day moving average, highlighting growing weakness across technology stocks.
President Donald Trump continues calling publicly for lower interest rates, but his economic advisers are now signaling patience, effectively allowing newly appointed Fed Chairman Kevin Warsh additional time to address inflation before making major policy changes.
Final Outlook
The next major catalyst will be the upcoming June PCE inflation report.
If inflation accelerates once again, the probability of another Federal Reserve rate hike will increase substantially.
The next FOMC meeting therefore becomes one of the most important macro events of the year.
Until inflation begins showing consistent signs of cooling, markets should continue assuming that interest rates will remain elevated—or potentially move even higher.
For traders, the current environment favors:
Lower leverage.
Stronger risk management.
Stablecoin yield strategies.
Maintaining dry powder for future market opportunities once inflation finally begins to reverse.
@Gate_Square
repost-content-media
  • Reward
  • 2
  • Repost
  • Share
Yusfirah:
2026 GOGOGO 👊
View More
#StakeUSD1Earn9.48%APR
Maximizing Stablecoin Yields: The 9.48% APR Opportunity in DeFi
The decentralized finance ecosystem continues to evolve, offering increasingly attractive yield opportunities for stablecoin holders seeking passive income generation. Current market conditions have created an environment where staking USD-pegged stablecoins can generate annual percentage rates approaching 9.48%, representing a compelling alternative to traditional savings vehicles that typically offer returns below 6%.
This elevated yield environment reflects several underlying dynamics within the DeFi sec
Falcon_Official
#StakeUSD1Earn9.48%APR
The stablecoin market is evolving fast, and USD1 is emerging as one of the most compelling yield opportunities in the space right now. If you have been sitting on idle stablecoin balances, this is the moment to put them to work.
USD1, issued by World Liberty Financial, has grown its supply to approximately $4.84 billion, cementing its position as a serious institutional-grade settlement asset. The stablecoin has seen rapid adoption across major exchanges, and Gate has become the second-largest holder of USD1 among centralized exchanges a milestone that underscores the depth of institutional confidence in this asset.
Market Overview
Gate's Soft Staking program for USD1 offers an estimated annual percentage rate of up to 9.48% APR, with no lock-up period and no extra steps required.
That is the key selling point.
You can continue trading, maintain margin positions, and still earn yield on your USD1 holdings simultaneously. There is no sacrifice of liquidity for yield.
In a market environment where BTC is probing the $60,000 support level and crypto volatility remains elevated, having a stablecoin position that generates nearly double-digit returns while remaining fully liquid is a strategic advantage.
The Numbers
Consider the math.
A $10,000 USD1 position staked at 9.48% APR generates approximately $948 in annual yield.
Compare that with:
Traditional savings accounts yielding under 1%.
USDC lending protocols on Aave offering around 5%.
The difference becomes obvious.
The APR is based on simple interest rather than compounding, but even without compounding, the effective return remains highly competitive against most low-risk alternatives across both crypto and traditional finance.
Additional Benefits
Gate has also introduced the USD1 Points Program in partnership with WLFI, creating the first rewards initiative designed specifically for USD1 holders.
Users can earn points by:
Trading USD1.
Holding USD1.
Participating in eligible investment products involving the stablecoin.
These points unlock additional platform benefits, expanding USD1's utility beyond simply acting as a settlement asset.
Regulatory Outlook
There is also an important regulatory angle worth monitoring.
The CLARITY Act, a comprehensive U.S. crypto market-structure bill, has already passed the House and a Senate committee but remains stalled amid political disputes related to crypto holdings, including USD1.
At the same time, Senate lawmakers are requesting investigations into significant foreign investment linked to World Liberty Financial.
While these developments introduce short-term regulatory uncertainty, they also demonstrate USD1's growing systemic importance.
Regulators are paying attention because the asset has become large enough to matter.
Final Outlook
For traders navigating today's macro environment where U.S. PCE inflation has climbed to 4.1% and the Federal Reserve continues signaling the possibility of another rate hike stablecoin yield strategies provide an attractive way to remain invested without taking significant directional market risk.
USD1's 9.48% APR through Gate Soft Staking is more than just an advertised number.
It reflects genuine market demand for the asset and presents an opportunity worthy of consideration within a diversified crypto portfolio.
The bottom line is simple:
Hold USD1, stake it on Gate with zero lock-up, earn up to 9.48% APR, and remain fully liquid so you can respond quickly whenever new market opportunities appear.
That is exactly the type of asymmetric setup experienced traders look for.
#USD1
@Gate_Square
repost-content-media
  • Reward
  • 2
  • Repost
  • Share
Yusfirah:
Ape In 🚀
View More
  • Pinned