ALEXKHAN

vip
Age 1.7 Year
Peak Tier 0
No content yet
#BitmineAdds100kETH
BitMine Immersion Technologies, an Ethereum-focused treasury company chaired by Tom Lee, continues to attract strong market attention with its aggressive accumulation strategy. The firm recently added approximately 100,000 ETH, reinforcing one of the most significant institutional Ethereum buying trends in 2026. This analysis breaks down the nine key aspects of this development and its broader market implications.
Point One: Understanding BitMine and Its Strategy
BitMine Immersion Technologies is positioning itself as a major Ethereum treasury entity similar to a Bitcoin-f
ETH1.88%
HighAmbition
#BitmineAdds100kETH
BitMine Immersion Technologies, an Ethereum-focused treasury company chaired by Tom Lee, continues to attract strong market attention with its aggressive accumulation strategy. The firm recently added approximately 100,000 ETH, reinforcing one of the most significant institutional Ethereum buying trends in 2026. This analysis breaks down the nine key aspects of this development and its broader market implications.
Point One: Understanding BitMine and Its Strategy
BitMine Immersion Technologies is positioning itself as a major Ethereum treasury entity similar to a Bitcoin-focused corporate reserve model. The company follows an aggressive accumulation strategy, consistently acquiring large ETH positions on a weekly basis.
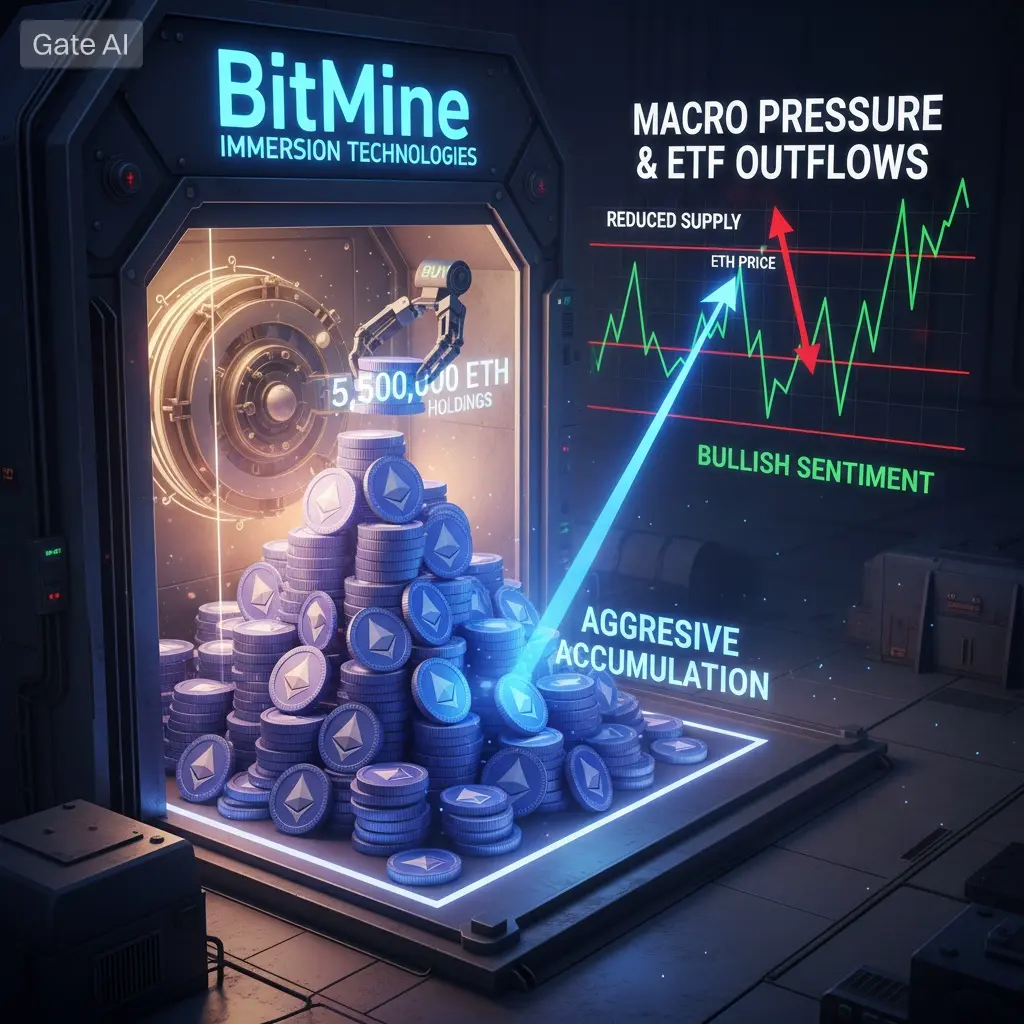
As of June 2026, BitMine’s total holdings are estimated at over 5.5 million ETH, representing approximately 4.5%–4.6% of total circulating supply. This makes it one of the largest known Ethereum holders globally.
A significant portion—around 85% to 92%—is staked, allowing the firm to generate continuous yield while maintaining long-term exposure. The company is also preparing additional capital raises exceeding $300 million+ to further expand its ETH accumulation strategy.
Point Two: The Scale of Recent Purchases
The latest acquisition of approximately 100,000 ETH reflects a capital deployment of nearly $170 million to $200 million, depending on execution price levels.
Some recent large-scale transactions in the market suggest even higher accumulation levels, with total weekly purchases occasionally exceeding 120,000–130,000 ETH, valued at roughly $200 million to $230 million+.
This consistent buying pattern highlights institutional conviction and sustained demand pressure on Ethereum’s supply structure.
Point Three: Market Impact on Ethereum Price
Ethereum has shown controlled volatility rather than sharp upward spikes, despite heavy institutional accumulation.
Current ETH price levels are estimated around $1,900 to $2,200, with recent highs approaching $2,300+ in strong momentum phases.
While institutional buying provides a strong structural support zone, broader macro conditions and market liquidity cycles continue to influence price action. The repeated accumulation creates a long-term price floor effect, reducing deep downside risk during corrections.
Point Four: Institutional Confidence Signal
BitMine’s strategy reflects strong institutional confidence in Ethereum’s long-term role in digital finance.
The company’s treasury position—estimated at $10B+ total assets including crypto and cash equivalents—shows deep commitment to ETH as a core reserve asset.
Such large-scale accumulation signals that institutional players increasingly view Ethereum as a strategic macro asset rather than a speculative instrument, especially as staking yields provide additional structural incentives.
Point Five: Ethereum Supply Dynamics
BitMine’s control of nearly 5% of circulating ETH supply, combined with staking of the majority of holdings, significantly reduces liquid market supply.
Ethereum’s deflationary pressure is further supported by:
EIP-1559 fee burning mechanism
Increased staking participation across institutions
Long-term holding behavior from treasury entities
This combination creates a tightening supply environment where available trading liquidity becomes increasingly limited during demand surges.
Point Six: Price Forecasts and Technical Outlook
Ethereum price forecasts for 2026 vary widely depending on market conditions:
Conservative Range: $2,000 – $2,800
Moderate Bull Case: $3,200 – $5,500
Extended Bull Cycle Scenario: $6,500 – $9,000
Extreme Bull Market Projection: $10,000 – $12,000+
Technical indicators show ETH maintaining strength above long-term moving averages, with RSI levels suggesting neutral-to-bullish momentum structure.
Key macro drivers include ETF inflows, staking growth, and Layer 2 ecosystem expansion.
Point Seven: Trader Sentiment and Market Psychology
Market sentiment has become increasingly reactive to institutional accumulation signals.
Traders view BitMine’s consistent purchases as:
A structural demand anchor
A psychological support factor
A long-term bullish confirmation signal
However, sentiment remains mixed due to ETF flow fluctuations and broader macro uncertainty. Despite this, institutional accumulation continues to dominate long-term market narratives.
Point Eight: Trading Strategies for ETH Investors
Several trading approaches are emerging in the current environment:
1. Accumulation Strategy:
Gradual buying in the $1,900–$2,100 range, focusing on long-term positioning.
2. Swing Trading Strategy:
Entry: $1,850 – $2,050
Targets: $2,400 – $2,800
Extended target: $3,200+
3. Breakout Strategy:
A confirmed break above $2,400 may trigger accelerated momentum toward higher resistance zones.
Risk Management:
Protective levels generally sit below $1,700, depending on volatility conditions.
Point Nine: Future Outlook and Key Levels to Watch
Key factors influencing Ethereum’s next major move include:
Continued institutional accumulation from treasury companies
ETF inflows and macro liquidity conditions
Expansion of staking participation
Layer 2 ecosystem growth and network activity
Important price zones:
Support: $1,900 / $1,700
Resistance: $2,400 / $2,800
Mid-term breakout zone: $3,200+
Bull cycle extension range: $5,000 – $9,000
If institutional demand continues at current levels, Ethereum could enter a long-term supply squeeze phase, potentially driving accelerated price discovery.
Conclusion
BitMine’s acquisition of 100,000 ETH reinforces a powerful institutional trend shaping Ethereum’s long-term market structure. While short-term price action remains influenced by macro volatility, the underlying accumulation narrative suggests strengthening fundamentals.
If institutional demand continues expanding alongside staking growth, Ethereum may be entering a structural revaluation phase over the coming market cycle.@Gate_Square #BlackRockReducesBTCIncreasesETH
repost-content-media
  • Reward
  • 1
  • Repost
  • Share
HighAmbition:
To The Moon 🌕
#SpaceX认购规模超2500亿美元
The SpaceX initial public offering represents one of the most significant financial events in recent market history. With investor demand exceeding $250 billion against a $75 billion fundraising target, the oversubscription rate of approximately 3.5 to 4 times demonstrates extraordinary market appetite for this aerospace and technology giant. The company plans to sell approximately 555.6 million shares at $135 per share, resulting in a valuation of approximately $1.77 trillion, which would position SpaceX as the seventh most valuable company in the United States and surpas
HighAmbition
#SpaceX认购规模超2500亿美元
The SpaceX initial public offering represents one of the most significant financial events in recent market history. With investor demand exceeding $250 billion against a $75 billion fundraising target, the oversubscription rate of approximately 3.5 to 4 times demonstrates extraordinary market appetite for this aerospace and technology giant. The company plans to sell approximately 555.6 million shares at $135 per share, resulting in a valuation of approximately $1.77 trillion, which would position SpaceX as the seventh most valuable company in the United States and surpass Tesla's current market capitalization of around $1.6 trillion.
SpaceX has established itself as a dominant force across multiple sectors including commercial space launch, satellite internet connectivity through Starlink, and artificial intelligence through its xAI division. The company generated approximately $15 billion in revenue during 2025, with Starlink contributing roughly 61 percent of total revenue. This diversified revenue stream provides a foundation for sustainable growth, though the recent merger with xAI has transformed the company from profitable to loss-making in the short term.
The IPO pricing at $135 per share reflects aggressive growth expectations built into the valuation. Morningstar has placed a fair value estimate of $780 billion on SpaceX, representing approximately 48 percent below the IPO target valuation. This significant discrepancy between market pricing and independent valuation estimates suggests that current pricing incorporates substantial future growth that has not yet materialized. The company has outlined ambitious plans including solar-powered data centers in space and targets a total addressable market of $28.5 trillion, with nearly $23 trillion attributed to enterprise artificial intelligence applications.
The allocation structure for this IPO includes an unusually large retail component, with approximately 30 percent of the offering reserved for individual investors. This approach leverages Elon Musk's substantial following among retail investors while broadening the ownership base. However, the massive oversubscription means that most retail participants will likely receive partial allocations rather than full subscription amounts.
From a growth perspective, SpaceX operates in sectors with substantial expansion potential. The global space economy continues to expand rapidly, with satellite internet representing a particularly attractive market given the billions of people worldwide lacking reliable internet access. The company's vertical integration and technological advantages in reusable rocket technology provide competitive moats that could sustain margins over time. Nevertheless, the valuation assumes flawless execution of ambitious projects including the fully reusable Starship vehicle and orbital artificial intelligence infrastructure.
The timing of this IPO coincides with heightened interest in artificial intelligence investments and continued enthusiasm for Elon Musk's business ventures. The listing on Nasdaq under ticker symbol SPCX is scheduled for June 12, 2026, following pricing determination on June 11. Goldman Sachs serves as lead underwriter for the offering.
For investors considering participation, several factors warrant careful evaluation. The current pricing embeds years of future growth, meaning the company must execute flawlessly to justify valuations. Competition in satellite internet is intensifying with Amazon's Project Kuiper and other entrants pursuing similar markets. Regulatory risks exist around spectrum allocation and space debris management. The company's pivot toward artificial intelligence integration introduces execution risks around technology development timelines.
The massive oversubscription indicates strong institutional confidence, but also creates potential for post-IPO volatility as initial trading may not reflect fundamental value. Historical patterns for highly anticipated IPOs often include initial price spikes followed by stabilization as supply and demand reach equilibrium. Investors should consider their time horizon and risk tolerance when evaluating position sizing.
Question One: Did you participate in the Gate SpaceX IPO subscription?
Participation in IPO subscriptions requires careful consideration of several factors including portfolio allocation, risk tolerance, and investment timeline. For those who participated through Gate's platform, the subscription process involves locking funds during the allocation period with final share distribution dependent on overall demand relative to available supply. Given the oversubscription levels, participants should expect partial fills rather than complete allocation of requested amounts.
The Gate platform provides retail access to IPO shares that would traditionally be reserved for institutional investors. This democratization of IPO access represents a significant development for individual investors seeking exposure to high-profile offerings. However, participants should understand that IPO investments carry inherent risks including price volatility and potential for immediate losses if aftermarket trading declines below subscription prices.
Question Two: What do you think the final price of SPCX will be? How much room for growth is there?
The final IPO pricing has been set at $135 per share based on available information. Post-listing price performance will depend on multiple factors including initial trading dynamics, broader market conditions, and investor sentiment toward growth stocks. Highly anticipated IPOs frequently experience initial price premiums as demand from investors who missed the allocation window enters the market through secondary trading.
Growth potential for SpaceX exists across multiple vectors. The Starlink satellite constellation continues expanding coverage and subscriber base, with potential to serve underserved markets globally. Commercial launch services benefit from increasing demand for satellite deployment and potential space tourism development. The artificial intelligence integration through xAI opens additional revenue streams though this area remains speculative with unproven monetization models.
The $28.5 trillion total addressable market cited by SpaceX represents theoretical maximum opportunity rather than near-term revenue potential. Actual growth realization depends on successful execution of ambitious technological development programs including Starship reusability, orbital data centers, and artificial intelligence infrastructure deployment. These projects carry substantial technical and financial risks that could delay or prevent achievement of projected milestones.
Analyst estimates vary considerably regarding fair value. Conservative valuations around $780 billion suggest limited upside from current pricing levels, while bullish scenarios envision SpaceX becoming the world's largest company based on successful execution of multi-planetary expansion and artificial intelligence dominance. The wide range of outcomes reflects fundamental uncertainty about timing and success of transformative projects.
Personal Perspective
From an analytical standpoint, SpaceX represents a compelling long-term investment thesis with significant near-term valuation risk. The company possesses genuine technological advantages and operates in expanding markets with substantial growth potential. However, the current valuation appears to fully discount years of successful execution, leaving limited margin for error or delays.
The massive oversubscription demonstrates market confidence but also creates potential for disappointment if post-IPO trading fails to deliver immediate gains. Historical precedent suggests that highly hyped IPOs often underperform in the months following listing as initial enthusiasm moderates and fundamental performance becomes the primary valuation driver.
For investors with long-term horizons and appropriate risk tolerance, SpaceX offers exposure to transformative technologies with potential to reshape multiple industries. However, position sizing should reflect the speculative nature of current valuations and the extended timeline required for many growth initiatives to mature. Dollar-cost averaging into positions over time may prove more prudent than concentrated initial allocations given valuation uncertainty.
The integration of artificial intelligence capabilities adds complexity to the investment thesis. While AI represents a significant growth opportunity, it also introduces competitive dynamics and capital requirements that differ from SpaceX's traditional aerospace business. Success in this area is less certain given intense competition from established technology companies and well-funded startups.
Overall, SpaceX deserves consideration as a portfolio holding for investors seeking exposure to space economy and artificial intelligence themes, but current pricing requires careful evaluation of risk-adjusted return potential relative to alternative investments in these sectors.@Gate_Square #CertifiedCreatorPromotionTask
repost-content-media
  • Reward
  • Comment
  • Repost
  • Share
#PredictWorldCupShare40000U
The 2026 FIFA World Cup kicks off this Friday with two exciting Group A fixtures that promise to set the tone for the tournament. As a football enthusiast and prediction market participant, I want to share my detailed analysis for both matches: Mexico versus South Africa and South Korea versus Czech Republic.
Match One: Mexico versus South Africa
Mexico enters this tournament as co-hosts and clear favorites in Group A. The match takes place at the iconic Estadio Azteca in Mexico City, giving El Tri a significant home advantage that cannot be understated. The stadiu
HighAmbition
#PredictWorldCupShare40000U
The 2026 FIFA World Cup kicks off this Friday with two exciting Group A fixtures that promise to set the tone for the tournament. As a football enthusiast and prediction market participant, I want to share my detailed analysis for both matches: Mexico versus South Africa and South Korea versus Czech Republic.
Match One: Mexico versus South Africa
Mexico enters this tournament as co-hosts and clear favorites in Group A. The match takes place at the iconic Estadio Azteca in Mexico City, giving El Tri a significant home advantage that cannot be understated. The stadium atmosphere will be electric, with passionate Mexican supporters creating an intimidating environment for any visiting team.
From a tactical perspective, Mexico under head coach Javier Aguirre has developed a solid 4-3-3 formation that emphasizes direct wide play and aggressive pressing. Captain Edson Alvarez anchors the midfield, providing defensive stability and distribution. Up front, veteran striker Raul Jimenez leads the line, supported by dynamic wingers Roberto Alvarado and Alexis Vega. The presence of young talent like 17-year-old Gilberto Mora adds creativity and unpredictability to their attack.
Mexico's recent form has been encouraging. They won the Concacaf Gold Cup last summer, defeating the United States 2-1 in the final. Their friendly matches have shown a team that is organized defensively and dangerous on set pieces. The psychological advantage of opening the World Cup at home cannot be ignored.
South Africa, on the other hand, returns to the World Cup stage for the first time since hosting the tournament in 2010. They are the lowest-ranked team in Group A and face an uphill battle against the hosts. However, they have demonstrated resilience in qualifying and will look to harness their underdog spirit.
South Africa's tactical approach typically relies on compact defending and quick counterattacks. They will need to be disciplined at the back and take advantage of any set-piece opportunities. The pressure of facing the hosts in the opening match could work against them, as Mexico will be highly motivated to start their campaign with a victory.
My prediction for this match is a Mexico win, likely by a 2-0 or 2-1 scoreline. The home advantage, superior individual quality, and tournament experience give Mexico a clear edge. South Africa will put up a fight, but the combination of Mexican attacking prowess and the hostile home crowd should see El Tri secure all three points.
Match Two: South Korea versus Czech Republic
The second Group A match features an intriguing contest between South Korea and Czech Republic at Estadio Akron in Guadalajara. This match is much more evenly balanced and could go either way, making it an interesting prospect for prediction markets.
South Korea enters this World Cup with mixed emotions. Their qualifying campaign was solid, conceding only eight goals throughout the process. However, recent form has been concerning, with heavy defeats to Brazil and Ivory Coast raising questions about their readiness for the tournament. Head coach Hong Myung-bo has faced criticism for his tactical decisions, and the team atmosphere appears strained.
The South Korean squad revolves around their captain and talisman, Son Heung-min. The Tottenham Hotspur forward scored ten goals during qualifying and remains their primary attacking threat. At 33 years old, this could be his final World Cup, and he will be determined to make it memorable. Supporting Son are players like Lee Kang-in and Kim Min-jae, who provide quality in midfield and defense respectively.
Tactically, South Korea has experimented with different formations, including a back three system. Their defensive organization is generally strong, but questions remain about their ability to create consistent goal-scoring opportunities beyond Son's individual brilliance.
Czech Republic qualified for this World Cup through back-to-back penalty shootout victories in the UEFA play-offs, demonstrating their mental toughness and resilience. While they may lack the star power of some other teams, their collective spirit and tactical discipline make them dangerous opponents.
The Czech team features striker Patrik Schick as their main goal threat. He provides a reliable focal point in attack and is capable of scoring from various situations. Their set-piece routines are particularly well-organized, and they will look to exploit any defensive lapses from South Korea.
Tactically, the Czech Republic tends to play a structured, organized game with emphasis on defensive solidity and quick transitions. Their experience in high-pressure situations during qualifying should serve them well in this tournament opener.
My prediction for this match is a closely contested draw, likely 1-1. South Korea has the advantage of possessing a world-class player in Son Heung-min, but their recent poor form and internal issues are concerning. Czech Republic's resilience and tactical organization could frustrate the Koreans, and I believe they have enough quality to secure a point. Alternatively, a narrow Czech victory would not surprise me given South Korea's current struggles.
Prediction Market Perspective
From a prediction market standpoint, both matches offer interesting opportunities. Mexico versus South Africa appears to be the more straightforward prediction, with Mexico heavily favored due to home advantage and superior quality. The South Korea versus Czech Republic match presents more uncertainty, which could create value for those willing to take calculated risks.
The World Cup is a tournament where form and rankings sometimes go out the window, replaced by passion, pressure, and the unpredictable nature of knockout football.
However, based on current form, tactical analysis, and historical patterns, my predictions stand as follows:
Mexico will defeat South Africa by two goals to nil, capitalizing on home advantage and superior attacking options. The match between South Korea and Czech Republic will end in a draw, with both teams showing respect for each other's defensive capabilities while struggling to create clear-cut chances.
These opening matches will set the tone for Group A, and I am excited to see how the tournament unfolds. The beauty of the World Cup lies in its ability to surprise us, and while predictions are based on analysis and data, the drama of the beautiful game often defies expectations.
I encourage everyone to participate in the Gate Square prediction event and share their own analysis. The combination of football knowledge and prediction market engagement makes this World Cup experience even more thrilling. Good luck to all participants, and may the best predictions win.#PredictWorldCupShare40000U @Gate_Square
repost-content-media
  • Reward
  • 1
  • Repost
  • Share
HighAmbition:
good information 👍👍
#BlackRockReducesBTCIncreasesETH
The world's largest asset manager, BlackRock, has made headlines with its recent strategic adjustment in the cryptocurrency market. According to data from Arkham Intelligence and various on-chain analytics platforms, BlackRock has been reducing its Bitcoin positions while significantly increasing its Ethereum holdings. This shift represents one of the most significant institutional reallocations in the crypto space and has profound implications for both assets.
Understanding BlackRock's Bitcoin Reduction
BlackRock's iShares Bitcoin Trust (IBIT) experienced sub
HighAmbition
#BlackRockReducesBTCIncreasesETH
The world's largest asset manager, BlackRock, has made headlines with its recent strategic adjustment in the cryptocurrency market. According to data from Arkham Intelligence and various on-chain analytics platforms, BlackRock has been reducing its Bitcoin positions while significantly increasing its Ethereum holdings. This shift represents one of the most significant institutional reallocations in the crypto space and has profound implications for both assets.
Understanding BlackRock's Bitcoin Reduction
BlackRock's iShares Bitcoin Trust (IBIT) experienced substantial outflows in recent months. According to SoSoValue data, IBIT recorded approximately 2.43 billion dollars in net outflows over nine consecutive sessions in May 2026, culminating in a massive 1.26 billion dollar dark-pool block sale on May 26. This marked the largest single-day redemption event in the fund's history since its January 2024 launch. On-chain data confirmed the transfer of approximately 6,005 BTC, equivalent to roughly 403 million dollars, from IBIT-linked custody wallets to Coinbase Prime.
The reasons behind this Bitcoin reduction are multifaceted. First, macroeconomic headwinds have created a challenging environment for risk assets. High US Treasury yields and a Federal Reserve stance perceived as constraining for risk assets have caused Bitcoin's price to drop below previous consolidation levels. Second, institutional de-risking has been a dominant theme, with many large players reducing exposure to volatile assets. Third, Bitcoin's price had been trading in a range with 74,000 dollars serving as support and the 200-day moving average as resistance, creating uncertainty about near-term direction.
Furthermore, BlackRock's crypto portfolio value declined sharply in the first quarter of 2026. Between January 1 and March 31, 2026, the combined value of BlackRock's Bitcoin and Ethereum holdings dropped from 78.36 billion dollars to 57.89 billion dollars, representing a 20.47 billion dollar decrease. While this decline was driven primarily by market conditions rather than capital exiting the portfolio, it signaled a need for strategic rebalancing.
Current Bitcoin Market Position and Price Analysis
As of early June 2026, Bitcoin opened at approximately 63,078 dollars, showing relative stability but remaining under pressure. The cryptocurrency has faced headwinds from multiple directions, including Federal Reserve policy uncertainty and shifting institutional sentiment. Bitcoin ETFs have experienced significant outflows, with the funds registering over 1.07 billion dollars in outflows during certain periods, on track to surpass previous weekly records.
The price action has been characterized by a trading range with 74,000 dollars serving as a key support level and the 200-day moving average acting as resistance. Analysts have noted that Bitcoin could revisit February lows if a major fresh catalyst does not emerge soon. The sustained ETF outflows and more hawkish Federal Reserve outlook have contributed to the market decline.
BlackRock's Ethereum Accumulation Strategy
In contrast to its Bitcoin reduction, BlackRock has been aggressively increasing its Ethereum exposure. The asset manager's iShares Ethereum Trust (ETHA) has recorded significant inflows, with the ETF hitting its highest inflows in 30 days at certain points. According to the latest data, ETHA's holdings reached over 2 million ETH, representing a major milestone for the fund.
BlackRock's staked ETH ETF (ETHB) has also seen substantial interest, pulling in 32.3 million dollars on April 24 alone. This rotation from the non-staked ETHA product into the staked ETHB product indicates a preference for yield-generating Ethereum exposure. The total assets under management for Ethereum ETFs collectively stood at approximately 30.35 billion dollars, with BlackRock controlling more than half at 17.25 billion dollars, representing roughly 3 percent of Ethereum's market capitalization.
Current Ethereum Market Position and Price Analysis
Ethereum entered mid-2026 trading in the 1,600 to 2,100 dollar range, down approximately 55 percent from its August 2025 all-time high near 4,954 dollars. The cryptocurrency faces a complex environment with strong on-chain fundamentals competing against macro-driven price drawdowns. Layer 2 networks have scaled Ethereum's capacity but have also diverted fee revenue from the mainnet, with some estimates suggesting Base alone removed 50 billion dollars from ETH's market cap.
Despite these challenges, Ethereum spot ETFs have shown resilience. While there have been periods of outflows, the overall trend indicates growing institutional interest. Ethereum DATs (Digital Asset Trusts) already hold more than 3.1 percent of the total ETH supply, and leading firms continue accumulating aggressively.
Reasons Behind BlackRock's Strategic Shift
Several factors explain BlackRock's decision to reduce Bitcoin exposure while increasing Ethereum holdings. First, Ethereum offers staking yield, providing a revenue stream that Bitcoin cannot match. BlackRock's ETHB product allows investors to earn staking rewards while maintaining ETF structure, making it attractive for institutional portfolios seeking yield in a high-interest-rate environment.
Second, Ethereum's ecosystem continues to expand with Layer 2 solutions, decentralized finance applications, and tokenization initiatives. BlackRock has shown increasing interest in tokenized assets and on-chain finance, areas where Ethereum dominates. The asset manager's involvement in projects like Securitize and tokenized securities aligns with Ethereum's capabilities.
Third, valuation considerations play a role. Bitcoin had experienced significant appreciation, and some institutional investors may view Ethereum as offering better risk-reward characteristics at current price levels. Ethereum's price decline from all-time highs has created a potentially more attractive entry point for long-term accumulation.
Fourth, diversification benefits drive the shift. As the cryptocurrency market matures, institutional investors are seeking exposure beyond just Bitcoin. Ethereum represents the second-largest cryptocurrency and offers different value propositions, including smart contract functionality and decentralized application platform capabilities.
Bitcoin Price Forecast and Trading Strategy
Analyst forecasts for Bitcoin vary widely, reflecting the uncertainty in the current market environment. Short-term targets suggest Bitcoin needs to reclaim the 74,000 dollar support level to establish a bullish trend. If this level is not defended, analysts warn of potential retests of February lows in the 55,000 to 60,000 dollar range.
Medium-term forecasts suggest Bitcoin could recover to the 80,000 to 100,000 dollar range if macroeconomic conditions improve and institutional inflows resume. However, this recovery depends on several factors, including Federal Reserve policy shifts, regulatory clarity, and renewed institutional confidence.
For trading strategy, risk management remains paramount in the current environment. Traders should consider the following approaches. First, dollar-cost averaging allows for gradual accumulation without attempting to time market bottoms. Second, maintaining stop-losses below key support levels protects against significant drawdowns. Third, monitoring ETF flow data provides insight into institutional sentiment. Sustained inflows would signal potential trend reversal, while continued outflows suggest further downside risk.
Ethereum Price Forecast and Trading Strategy
Ethereum price predictions for 2026 show considerable variation among analysts. Conservative estimates target the 1,700 to 2,000 dollar range, with some analysts projecting prices around 2,011 dollars as an average trading price. More optimistic forecasts suggest Ethereum could reach 3,175 to 7,500 dollars depending on market conditions and adoption trends.
The key factors influencing Ethereum's price include Layer 2 adoption rates, staking participation, institutional ETF inflows, and the overall health of the decentralized finance ecosystem. Ethereum's transition to a yield-bearing asset through staking has fundamentally changed its investment profile, making it attractive for income-focused institutional portfolios.
For trading strategy, Ethereum presents both opportunities and risks. The staking yield provides a cushion during price declines, as holders earn rewards regardless of price action. However, Layer 2 competition and fee revenue diversion remain concerns. Traders should monitor ETF inflow data, particularly for BlackRock's ETHA and ETHB products, as these indicate institutional sentiment. Additionally, watching Layer 2 metrics and total value locked in decentralized finance protocols provides insight into ecosystem health.
Future Outlook and Strategic Implications
BlackRock's shift from Bitcoin to Ethereum reflects broader trends in institutional cryptocurrency allocation. As the market matures, investors are moving beyond simple Bitcoin exposure to more sophisticated strategies that include yield generation and ecosystem participation.
The implications for both assets are significant. Bitcoin may face continued pressure if institutional outflows persist, though its status as digital gold and store of value remains intact. Ethereum stands to benefit from institutional adoption of staking and the growth of on-chain finance, though it must navigate challenges related to scalability and competition from Layer 2 solutions.
For investors, the key takeaway is that diversification within the cryptocurrency space is becoming increasingly important. Following institutional flows, particularly from major players like BlackRock, provides valuable insight into market direction. However, individual risk tolerance and investment horizons should guide portfolio decisions rather than simply mimicking institutional moves.
The cryptocurrency market continues to evolve rapidly, and BlackRock's strategic adjustments demonstrate that even the largest asset managers are actively managing their crypto allocations based on changing market conditions, yield opportunities, and ecosystem developments. As we move through 2026, monitoring these institutional flows will remain crucial for understanding market dynamics and identifying potential opportunities in both Bitcoin and Ethereum.
#CertifiedCreatorPromotionTask @Gate_Square
repost-content-media
  • Reward
  • 1
  • Repost
  • Share
HighAmbition:
Diamond Hands 💎
#PredictWorldCupShare40000U
📢 Gate Square | Polymarket June 10 World Cup Special: Mexico 🆚 South Africa, Korea 🆚 Czech Who will win?
The World Cup Group A first round kicks off this Friday! Mexico vs South Africa, Korea vs Czech. Who will win the first match? Come and make your bold prediction!
💥 Easy two-step participation:
1️⃣ Post with #广场预测世界杯赢40000U and trading cards, or share the official event in the Square
👉️ https://www.gate.com/competition/football-2026
2️⃣ The post content can be about predicting match results, analyzing win probabilities, sharing trading strategies
HighAmbition
#PredictWorldCupShare40000U
📢 Gate Square | Polymarket June 10 World Cup Special: Mexico 🆚 South Africa, Korea 🆚 Czech Who will win?
The World Cup Group A first round kicks off this Friday! Mexico vs South Africa, Korea vs Czech. Who will win the first match? Come and make your bold prediction!
💥 Easy two-step participation:
1️⃣ Post with #广场预测世界杯赢40000U and trading cards, or share the official event in the Square
👉️ https://www.gate.com/competition/football-2026
2️⃣ The post content can be about predicting match results, analyzing win probabilities, sharing trading strategies/screenshots, etc.
💰 Triple prizes waiting for you:
1️⃣ Daily prize: 10 “Daily Prediction Kings” selected each day to share $500!
2️⃣ Weekly prize: 50 lucky sharers drawn weekly to share $1,000!
3️⃣ Leaderboard prize: Climb the weekly/monthly leaderboard to win limited edition Gate World Cup jerseys and prediction market experience coupons!
Details: https://www.gate.com/announcements/article/51597
repost-content-media
  • Reward
  • 1
  • Repost
  • Share
HighAmbition:
Diamond Hands 💎
#SpotGoldFallsBelow4200Dollars
Spot gold refers to the current market price at which gold can be bought or sold for immediate delivery or settlement. This is the real-time trading price in international markets, reflecting the actual supply and demand dynamics at any given moment. Spot gold serves as the benchmark for all gold-related financial instruments including futures, CFDs, and ETFs.
What Does Falls Below $4,200 Mean
When gold prices fall below the $4,200 level, it represents a significant psychological and technical support level being broken. This thre
XAU-2.25%
  • Reward
  • 1
  • Repost
  • Share
HighAmbition:
To The Moon 🌕
#BitmineAdds100kETH
#BitmineAdds100kETH
BitMine Immersion Technologies, an Ethereum-focused treasury company chaired by Tom Lee, continues to attract strong market attention with its aggressive accumulation strategy. The firm recently added approximately 100,000 ETH, reinforcing one of the most significant institutional Ethereum buying trends in 2026. This analysis breaks down the nine key aspects of this development and its broader market implications.
Point One: Understanding BitMine and Its Strategy
BitMine Immersion Technologies is positioning itself as a major Ethereum treasury entity s
ETH1.88%
BTC2.29%
  • Reward
  • Comment
  • Repost
  • Share
#BitmineAdds100kETH
#BitmineAdds100kETH
BitMine Immersion Technologies, an Ethereum-focused treasury company chaired by Tom Lee, continues to attract strong market attention with its aggressive accumulation strategy. The firm recently added approximately 100,000 ETH, reinforcing one of the most significant institutional Ethereum buying trends in 2026. This analysis breaks down the nine key aspects of this development and its broader market implications.
Point One: Understanding BitMine and Its Strategy
BitMine Immersion Technologies is positioning itself as a major Ethereum treasury entity s
ETH1.88%
  • Reward
  • Comment
  • Repost
  • Share
#MyGateTradeStory
That one trade on NVDA changed everything for me. I had been watching NVIDIA for weeks, tracking every move, every dip, every rally, but I kept hesitating. The chart was calling me, the setup was right there, yet my fingers refused to click the button. Fear of the unknown, fear of being wrong, fear of losing what I had worked so hard to build. But then something shifted.
It was a quiet afternoon, the market barely moving, most traders half asleep at their desks. NVDA had pulled back to a level I had marked on my chart days before. The support zone was clean, the volume was d
HighAmbition
#MyGateTradeStory
That one trade on NVDA changed everything for me. I had been watching NVIDIA for weeks, tracking every move, every dip, every rally, but I kept hesitating. The chart was calling me, the setup was right there, yet my fingers refused to click the button. Fear of the unknown, fear of being wrong, fear of losing what I had worked so hard to build. But then something shifted.
It was a quiet afternoon, the market barely moving, most traders half asleep at their desks. NVDA had pulled back to a level I had marked on my chart days before. The support zone was clean, the volume was drying up on the selling side, and the momentum indicators were whispering the same thing: this dip was running out of fuel. I remember staring at the screen for what felt like an hour, my cursor hovering over the buy button, my heart doing things it should not be doing over a trade. Then I pulled the trigger. I went long on NVDA through Gate's contract trading, sized the position carefully, not too aggressive, not too timid, just enough to make it count if the trade worked and survivable if it did not.
The first few minutes were agonizing. The price wiggled, teased, dipped a fraction lower, and I felt that familiar knot in my stomach questioning every decision I had ever made in markets. But I held. Not because I was brave, but because the logic behind the trade was solid. NVIDIA was and still is the backbone of the AI revolution. Every major tech company is building on their chips, their data centers, their ecosystem. A short-term pullback does not erase a long-term thesis, and I reminded myself of that fact over and over while the price sorted itself out.
Then the move came. It was not a dramatic rocket launch, not a screen-shaking green candle that makes you jump out of your chair. It was a steady, methodical climb, the kind of move that rewards patience and punishes impulsiveness. NVDA pushed higher, tick by tick, and my position shifted from floating in uncertainty to sitting in profit. I watched the profit counter climb, and when it hit $5, I closed the trade. Five dollars. Some would laugh at that number. Five dollars is barely a cup of coffee in most cities. But for me, that $5 was everything.
Why? Because that $5 was not about the money. It was about proof. Proof that my analysis was not just theory. Proof that I could act when the moment arrived instead of watching it pass and then drowning in regret. Proof that discipline, patience, and trusting your setup actually pays off, even in small increments. Before that NVDA trade, I was a trader who overthought everything, who second-guessed every entry, who spent more time replaying missed opportunities than executing new ones. After that trade, something broke open inside me, not recklessly, but with a quiet confidence that said: you can do this, you can read the market, you can act on what you see.
NVDA is trading around $208 right now, up nearly 5% from its April lows near $199, and the AI narrative continues to fuel momentum across the entire semiconductor space. NVIDIA is not just a stock, it is the engine behind the most transformative technology shift of our generation. Understanding that thesis gave me the conviction to enter, and the discipline to exit with a modest but meaningful profit. The best trade is not always the biggest one. Sometimes the best trade is the one that teaches you who you are as a trader.
For anyone just starting out in crypto or traditional markets, here is what I learned from that single NVDA position. First, mark your levels before the market gets there, not during the move when emotions are running hot. Second, size your trades so that even a loss does not knock you out of the game entirely. Third, let the setup breathe. Once you enter, give it room to work. A trade that dips slightly against you before heading in your direction is normal, not a failure. Fourth, take profit when your target is hit. Do not turn a good trade into a bad one by holding for a fantasy move that may never come. And fifth, remember that every profitable trade, no matter how small, is a building block. Stack enough of them and the compound effect takes care of the rest.
Trading is not about hitting home runs every day. It is about showing up, doing the work, trusting your process, and learning from every single click of that button. My $5 on NVDA was not a jackpot, but it was the trade that made me believe I belonged in this market. And that belief is worth far more than any dollar amount on a screen.
This is my Gate trading moment. That one NVDA trade turned hesitation into conviction, and that conviction is what I carry into every position I take today.
#我的Gate交易时刻
@Gate_Square
repost-content-media
  • Reward
  • Comment
  • Repost
  • Share
#SpotGoldFallsBelow4200Dollars
Spot gold refers to the current market price at which gold can be bought or sold for immediate delivery or settlement. This is the real-time trading price in international markets, reflecting the actual supply and demand dynamics at any given moment. Spot gold serves as the benchmark for all gold-related financial instruments including futures, CFDs, and ETFs.
What Does Falls Below $4,200 Mean
When gold prices fall below the $4,200 level, it represents a significant psychological and technical support level being broken. This threshold has been watched closely b
XAU-2.25%
HighAmbition
#SpotGoldFallsBelow4200Dollars
Spot gold refers to the current market price at which gold can be bought or sold for immediate delivery or settlement. This is the real-time trading price in international markets, reflecting the actual supply and demand dynamics at any given moment. Spot gold serves as the benchmark for all gold-related financial instruments including futures, CFDs, and ETFs.
What Does Falls Below $4,200 Mean
When gold prices fall below the $4,200 level, it represents a significant psychological and technical support level being broken. This threshold has been watched closely by traders and investors as it marked a consolidation zone where buying interest historically emerged. Breaking below this level signals potential weakness in the bullish trend that dominated much of 2025 and early 2026.
Why This News Matters
The breach of the $4,200 support level carries substantial importance for several reasons. First, it indicates a shift in market sentiment from bullish to potentially bearish or consolidation phase. Second, it triggers automatic selling from algorithmic trading systems programmed to exit positions when key support levels fail. Third, it may lead to a reassessment of portfolio allocations among institutional investors who view gold as a safe-haven asset. The breakdown also suggests that the factors supporting higher gold prices are losing their grip, at least in the short term.
How Investors React to This Development
Investor reactions typically diverge based on their trading horizon and risk appetite. Short-term traders often view this breakdown as a signal to reduce exposure or initiate short positions, anticipating further downside momentum. Long-term investors may see this as an opportunity to accumulate gold at lower prices, believing the fundamental drivers remain intact. Some institutional investors rebalance their portfolios, reducing gold allocations temporarily while waiting for clearer directional signals. Retail investors often panic sell during such breaks, exacerbating the downward pressure.
Potential Reasons Behind the Price Decline
Several interconnected factors have contributed to gold falling below $4,200. The strengthening US Dollar has made gold more expensive for holders of other currencies, reducing international demand. Rising interest rate expectations, particularly the possibility of Federal Reserve rate hikes rather than cuts, have increased the opportunity cost of holding non-yielding assets like gold. Profit-taking by investors who bought at lower levels in 2025 has added selling pressure. Additionally, easing geopolitical tensions in certain regions have reduced the safe-haven demand that previously supported prices. Strong US employment data has reinforced expectations of tighter monetary policy, further weighing on gold.
Does This Mean Gold Will Fall Further
A break below $4,200 does not guarantee continued decline. Markets often experience false breakdowns where prices briefly violate support before recovering. If buyers re-enter aggressively at current levels or if new catalysts emerge, prices could stabilize and reverse. Technical analysts watch for confirmation through sustained trading below support, volume patterns, and subsequent price action to determine whether this is a genuine trend change or temporary correction. The presence of strong demand zones between $3,800 and $4,000 suggests potential support areas where buying interest may emerge.
What This Means for Traders
Traders now view the $4,200 level as a critical reference point. Previously support, it now acts as resistance. Sustained trading below this level suggests further weakness toward $4,000 or lower. A reclaim of $4,200 with conviction would signal potential recovery and renewed bullish momentum. Risk management becomes crucial, with stop-loss placements and position sizing adjusted to account for increased volatility. Traders also monitor derivative markets for clues about sentiment, including options positioning and futures open interest.
Impact on Ordinary People
International gold price movements eventually affect local gold markets, though the transmission is not immediate or uniform. Local prices depend on currency exchange rates, import duties, taxes, and local supply-demand dynamics. When international prices decline, consumers may benefit from lower jewelry and investment gold prices, potentially stimulating physical demand. However, if currency depreciation occurs simultaneously, the local price impact may be muted. Central banks may also adjust their gold purchasing strategies based on these price movements.
Current Market Conditions and Forecast
As of early June 2026, gold is trading around $4,148, having declined approximately 2.64 percent recently and over 12 percent from recent highs. Despite this pullback, major financial institutions maintain bullish long-term forecasts. Goldman Sachs projects gold reaching $4,000 to $4,200 as a base case, with potential to reach $5,055 by the fourth quarter of 2026. Bank of America sees prices averaging $4,400 with upside potential to $5,000 if investment demand increases by 14 percent. ING forecasts $4,100 by the first quarter of 2026 with further upside through the year. Metals Focus predicts an annual average of $4,920 for 2026, representing a 43 percent increase from 2025 levels. J.P. Morgan expects gold to push toward $5,000 by the fourth quarter of 2026, with $6,000 possible longer term supported by central bank demand averaging approximately 585 tonnes quarterly.
Trading Strategy and Next Steps
For traders navigating this environment, several approaches merit consideration. Short-term traders might employ range-bound strategies between $4,000 and $4,200, using tight stops below $3,950. Medium-term position traders could accumulate gradually on weakness toward $4,000 and $3,800 support zones, scaling into positions rather than committing fully at once. Long-term investors may view current levels as attractive entry points given the institutional forecasts targeting $5,000 and above. Risk management remains paramount, with position sizes appropriate for volatility and clear exit strategies defined before entering trades.
How High Can Gold Go
Based on current institutional forecasts and technical analysis, gold has potential to reach $5,000 to $5,600 in the coming 12 to 18 months. The 161.8 percent Fibonacci extension level sits around $5,600, representing approximately 40 percent upside from current levels. Catalysts that could drive such moves include renewed geopolitical tensions, Federal Reserve pivoting to rate cuts, currency devaluation concerns, and continued central bank accumulation. However, the path is unlikely to be linear, with corrections and consolidation phases expected along the way.
Conclusion
Gold falling below $4,200 represents a significant technical development that has shifted short-term sentiment while long-term fundamentals remain supportive. The confluence of dollar strength, interest rate expectations, and profit-taking has created this pullback, but institutional forecasts suggest higher prices ahead. Traders should remain flexible, adapting strategies to evolving market conditions while maintaining appropriate risk management. The current environment offers both challenges for existing long positions and opportunities for patient accumulation at lower levels. Monitoring key support at $4,000 and resistance at $4,200 will guide near-term trading decisions, while the broader outlook toward $5,000 and beyond remains constructive for those with longer time horizons.@Gate_Square
repost-content-media
  • Reward
  • Comment
  • Repost
  • Share
#MyGateTradeStory
---
Welcome to Gate.io – Your Complete Beginner's Trading Guide
Congratulations on joining the **#MyGateTradeStory** event! As a new trader on Gate.io, this comprehensive guide will walk you through everything you need to know to start trading confidently. Let's begin your trading journey!
---
Step 1: Get Started on Gate.io
Download the App
Visit [Gate.com/appdownload](https://www.gate.com/appdownload) to download the Gate.io app on your mobile device or use the web version on your computer.
Create Your Account
Sign up with your email or phone number and set a strong passwor
BTC2.29%
ETH1.88%
  • Reward
  • 3
  • Repost
  • Share
HighAmbition:
Diamond Hands 💎
View More
**#CertifiedCreatorPromotionTask
The FIFA World Cup is more than just football—it is one of the biggest global events that attracts millions of passionate fans.
With Gate's Polymarket Prediction Hub, users can follow tournament developments while exploring prediction markets tied to match outcomes and team performance.
Prediction markets offer a unique way to combine sports knowledge with market sentiment, allowing participants to engage with the competition in a completely new way.
As the tournament unfolds, every match creates fresh opportunities to test your analysis and decision-making
HighAmbition
**#CertifiedCreatorPromotionTask
The FIFA World Cup is more than just football—it is one of the biggest global events that attracts millions of passionate fans.
With Gate's Polymarket Prediction Hub, users can follow tournament developments while exploring prediction markets tied to match outcomes and team performance.
Prediction markets offer a unique way to combine sports knowledge with market sentiment, allowing participants to engage with the competition in a completely new way.
As the tournament unfolds, every match creates fresh opportunities to test your analysis and decision-making skills.
Explore the World Cup experience on Gate and see how your predictions compare with the crowd.
#CertifiedCreatorPromotionTask
repost-content-media
  • Reward
  • 1
  • Repost
  • Share
HighAmbition:
thnx for sharing
#PredictNBAFinalsWin20000U
The 2026 NBA Finals have reached a critical juncture as the New York Knicks and the San Antonio Spurs head into Game 3 at Madison Square Garden on June 9, 2026. The Knicks have seized a commanding 2-0 series lead after winning both Games 1 and 2 on the Spurs home court in San Antonio, putting the young Spurs roster in a historically precarious position. No team in NBA Finals history has ever overcome an 0-2 deficit after losing both opening games at home to ultimately win the championship. This statistic alone underscores the gravity of the moment for San Antonio an
HighAmbition
#PredictNBAFinalsWin20000U
The 2026 NBA Finals have reached a critical juncture as the New York Knicks and the San Antonio Spurs head into Game 3 at Madison Square Garden on June 9, 2026. The Knicks have seized a commanding 2-0 series lead after winning both Games 1 and 2 on the Spurs home court in San Antonio, putting the young Spurs roster in a historically precarious position. No team in NBA Finals history has ever overcome an 0-2 deficit after losing both opening games at home to ultimately win the championship. This statistic alone underscores the gravity of the moment for San Antonio and the magnitude of the opportunity staring New York in the face. Gate, one of the leading cryptocurrency exchanges, has launched a Polymarket Prediction Market event tied directly to this Finals showdown, offering a 20,000 USDT prize pool for participants who predict the outcome. The current odds on the Gate Polymarket platform show the Knicks at 51 percent and the Spurs at 49 percent, reflecting the razor-thin margin between the two teams despite New York holding a 2-0 series advantage. This near-even split tells an important story: the market recognizes that while the Knicks have the series lead, the Spurs still possess the talent and resilience to make this a competitive contest.
Game 1 on June 3 saw the Knicks pull away with a dominant 11-0 closing run to secure a 105-95 victory. The Spurs struggled from the floor in that opening contest, and the free throw disparity tilted in New York's favor. Game 2 continued the pattern of tightly contested basketball where the Spurs had chances to win but could not close the deal. Through two games, the Spurs bench has been a significant concern, shooting just 20 percent from the field and 14.2 percent from three-point range outside of Harper's contributions. San Antonio's supporting cast around their star Victor Wembanyama has failed to provide the offensive spark needed to counter New York's depth and defensive intensity. On the Knicks side, Karl-Anthony Towns has emerged as a Finals MVP candidate, anchoring the defense against Wembanyama while contributing approximately 20.1 points, 11.9 rebounds, and 3.0 assists per game. Jalen Brunson continues to orchestrate the offense with precision, and Mikal Bridges has been instrumental with his all-around contributions, recording 20 points and six assists in Game 2 while consistently surpassing his combined points, rebounds, and assists thresholds throughout the Knicks' remarkable 13-game playoff winning streak.
The betting markets for Game 3 show the Knicks as 2.5-point favorites at FanDuel Sportsbook with an over/under of 216.5 total points. Multiple expert models and analysts, including CBS Sports' SportsLine Projection Model which simulates every NBA game 10,000 times, are leaning toward the Under on the total given that the Under has hit in each of the last three head-to-head matchups between these teams. The Under has also connected at a 68 percent clip for the Spurs following a loss and at 58 percent for the Knicks after a win, suggesting that Game 3 could follow a similar low-scoring pattern. From a strategic standpoint, Game 3 presents a fascinating tactical chess match. The Spurs enter Madison Square Garden desperate to avoid a 3-0 deficit that would effectively seal their fate, while the Knicks aim to capitalize on their home crowd energy and put the series on ice. New York's home court advantage at MSG is legendary, and the Knicks' current 13-game playoff winning streak demonstrates a level of sustained excellence that few teams in recent NBA history have matched. However, desperation can be a powerful motivator, and the Spurs' 62-win regular season proves this roster has the capability to perform at an elite level.
The Gate Polymarket Prediction Market event provides an accessible and rewarding way for fans and traders to engage with this historic Finals matchup. The event structure breaks down into three distinct benefit tiers designed to maximize participant rewards. Benefit 1 offers a 10,000 USDT prize pool where users who complete identity verification and participate in the Knicks vs Spurs prediction trading with a minimum of 20 USDT will receive a 10 USDT reward after the match settles, limited to the first 1,000 participants on a first-come basis. Benefit 2 adds a 5,000 USDT pool exclusively for newly registered users making their first prediction trade with at least 20 USDT, granting them an additional 10 USDT on top of the Benefit 1 reward for a total of 20 USDT, capped at the first 500 new users. Benefit 3 introduces a referral incentive where inviting new users who register and complete a qualifying prediction trade earns the inviter 10 USDT per referral, with a maximum of 10 qualified invitees per inviter yielding up to 100 USDT in stacked rewards, drawing from a 5,000 USDT pool. All rewards are distributed as Polymarket Prediction Market Trial Vouchers that cannot be withdrawn directly but can be used for further prediction trading on the platform, with profits generated from those vouchers being withdrawable. The trial vouchers carry a validity period detailed on the Prediction Market Assets page, and unused vouchers expire automatically after their validity ends.
Participation requires clicking the Participate Now button on the event page, completing registration and identity verification, navigating to the Polymarket Prediction Market under the Basketball category in the Gate App's Alpha section, selecting the Knicks vs Spurs market, and executing a prediction trade. Rewards are distributed within 14 working days after the event concludes and the match settles. The event is open from June 4, 2026, and the event period extends through the conclusion of Game 2. Several important restrictions apply: users in jurisdictions where prediction markets, betting, or derivatives trading are prohibited may not participate; VPN usage, false identities, and circumvention of regional or KYC restrictions are strictly forbidden; and sub-accounts, API users, VIP 14 and above, market makers, corporate, institutional, and agent accounts are ineligible.
Now, turning to my personal analysis and prediction for which team will win this matchup. The evidence strongly favors the New York Knicks winning the 2026 NBA Finals, and I believe they will close this out, potentially in five or six games. My reasoning rests on several key factors. First, the historical precedent of no team ever recovering from an 0-2 home loss deficit in the Finals is an almost insurmountable psychological and statistical barrier. Second, the Knicks' 13-game playoff winning streak is not a fluke but a testament to their cohesive team defense, balanced scoring, and veteran composure under pressure. Third, Towns' ability to anchor the interior defense against Wembanyama while maintaining elite offensive production gives New York a tactical edge that the Spurs have not been able to counter through two games. Fourth, the Spurs' bench production has been alarmingly poor, and unless San Antonio can unlock meaningful contributions from their reserves, the offensive burden falls disproportionately on Wembanyama, which the Knicks have successfully contained. Fifth, Madison Square Garden provides a formidable home court environment that will amplify the Knicks' energy and potentially rattles a young Spurs roster that has not experienced this level of postseason adversity. The Spurs are a talented team with a legitimate superstar, and they could win Game 3 out of sheer desperation and Wembanyama's individual brilliance, but winning four of the remaining five games against a Knicks team operating at this level of consistency and confidence appears unlikely. My pick: New York Knicks win the 2026 NBA Finals. On the Gate Polymarket, the Knicks at 51 percent represent a slight value position given the 2-0 series lead and historical data supporting their advantage, making them the more compelling prediction choice. This event is independent of the NBA and any associated organizations. Prediction markets carry inherent risks including price volatility, liquidity, and settlement uncertainty. Participate prudently and never invest more than you can afford to lose.@Gate_Square #CreatorCarnaival
repost-content-media
  • Reward
  • 1
  • Repost
  • Share
HighAmbition:
thanks for sharing
#GateIPOAccessSpaceX
Gate has officially launched IPO Access, a new feature that gives eligible users direct access to subscribe to real IPO shares before public trading begins. This marks a significant shift in how retail investors can participate in traditional equity markets, eliminating the need for external brokers and creating a seamless path from subscription to trading within the Gate ecosystem.
The inaugural project is SpaceX, one of the most anticipated IPOs in modern financial history. Founded by Elon Musk in 2002, SpaceX has evolved from a rocket startup into a multi-trillion-doll
HighAmbition
#GateIPOAccessSpaceX
Gate has officially launched IPO Access, a new feature that gives eligible users direct access to subscribe to real IPO shares before public trading begins. This marks a significant shift in how retail investors can participate in traditional equity markets, eliminating the need for external brokers and creating a seamless path from subscription to trading within the Gate ecosystem.
The inaugural project is SpaceX, one of the most anticipated IPOs in modern financial history. Founded by Elon Musk in 2002, SpaceX has evolved from a rocket startup into a multi-trillion-dollar enterprise spanning satellite broadband, government contracts, and artificial intelligence. The company operates over ten thousand active Starlink satellites, representing roughly two-thirds of all working satellites currently in orbit. It serves more than ten million subscribers globally and reported eighteen point six seven billion dollars in revenue for 2025, representing thirty-three percent growth from the previous year.
The SpaceX IPO aims to raise approximately seventy-five billion dollars by selling five hundred fifty-five point six million shares at one hundred thirty-five dollars per share. This would value the company at roughly one point seven seven trillion dollars, making it the largest IPO in United States history. The company will trade on the Nasdaq under the ticker SPCX. Analyst estimates for fair value range from one point two trillion to over two trillion dollars, reflecting genuine debate about how to weigh SpaceX's proven businesses against its more speculative ventures.
For Gate users, participation is remarkably accessible. The minimum investment is just one hundred USDT, while the maximum is capped at five hundred thousand USDT. The subscription uses USDT as the base asset, meaning users can participate directly without converting funds through external banking systems. A five percent intent subscription fee applies only upon successful allocation, bringing the total reference cost per share to approximately one hundred forty-one point seventy-five USDT.
The timeline runs from June 9, 2026 at 10:00 UTC to June 12, 2026 at 04:00 UTC, giving participants a sixty-six hour subscription window. Share distribution is estimated for June 12 between 14:00 and 15:00 UTC, with trading expected to begin at 13:30 UTC the same day. Allocation is based on hourly average locked amounts during the subscription period, with earlier participation receiving higher weight in the allocation formula.
It is important to understand that this is an intent subscription, not a guaranteed allocation. Users may receive full allocation, partial allocation, or no allocation depending on the actual IPO issuance volume and Gate's secured quota. If the final IPO price deviates within twenty percent of the reference price, allocation proceeds automatically. Beyond twenty percent, secondary confirmation is required. Subscription funds remain locked during the intent period and cannot be traded, transferred, or withdrawn. Unallocated funds are returned after distribution.
Successfully allocated shares are distributed directly to the user's Gate stock account with no lock-up period, meaning one hundred percent of shares are immediately available for trading. The Gate App must be updated to version eight point twenty-one point five or above to access stock trading functionality.
SpaceX represents more than a rocket company. Its business spans seven major segments including Starlink Consumer Broadband, which analysts consider the primary valuation driver, along with Enterprise and Maritime connectivity, Government and Defense contracts, Falcon launch operations, Starship development, Direct-to-Cell satellite communications, and the recently acquired xAI subsidiary focused on artificial intelligence integration with orbital infrastructure. The total addressable market claimed in the prospectus is twenty-eight point five trillion dollars, with the majority attributed to AI opportunities.
The significance of Gate IPO Access extends beyond this single offering. Historically, IPO participation was dominated by institutional underwriters and privileged brokerage clients. SpaceX has indicated that up to thirty percent of shares may be allocated to retail investors, a substantial departure from conventional models. By building this capability into its platform, Gate creates a bridge between digital asset markets and traditional finance, allowing users to move seamlessly from crypto trading to IPO subscription to stock trading within a single ecosystem.
For participants, strategic considerations include committing funds earlier in the subscription window to maximize allocation weight, maintaining sufficient liquidity outside the locked subscription amount, and understanding that allocation is probabilistic rather than guaranteed. The absence of a lock-up period provides flexibility to respond to market conditions from the first moments of trading.
The SpaceX IPO is expected to generate substantial market attention. Elon Musk would become the first trillionaire at the planned offering price. Early Nasdaq-100 index inclusion is reportedly a condition of the listing, which could trigger significant passive buying from index-tracking funds. Options activity in related stocks has already surged in anticipation.
To participate, eligible users navigate to IPO Access through the Gate App or website, select SpaceX, and commit USDT during the subscription window. This represents the beginning of a new channel for global IPO participation, with SpaceX as the historic starting point and future offerings potentially expanding the range of opportunities available to Gate users across both digital and traditional financial markets.
@Gate_Square #CreatorCarnival
repost-content-media
  • Reward
  • 1
  • Repost
  • Share
HighAmbition:
good information 👍👍👍
#Gate直通IPO认购SpaceX
Gate has officially launched its Direct IPO Access feature, and the debut project is SpaceX, the aerospace and technology company founded by Elon Musk in 2002. This marks a major milestone for retail participation in large-scale private-to-public transitions, with SpaceX positioned as one of the most anticipated IPO events in modern financial history. The offering is being discussed around a target valuation of approximately 1.75 trillion dollars with an estimated fundraising size of 75 billion dollars under the Nasdaq listing narrative. This places SpaceX among the most va
NAS100-2.31%
NAS100100-2.31%
NAS10020-2.31%
HighAmbition
#Gate直通IPO认购SpaceX
Gate has officially launched its Direct IPO Access feature, and the debut project is SpaceX, the aerospace and technology company founded by Elon Musk in 2002. This marks a major milestone for retail participation in large-scale private-to-public transitions, with SpaceX positioned as one of the most anticipated IPO events in modern financial history. The offering is being discussed around a target valuation of approximately 1.75 trillion dollars with an estimated fundraising size of 75 billion dollars under the Nasdaq listing narrative. This places SpaceX among the most valuable companies ever to enter public markets, potentially surpassing historic benchmarks set by previous mega-IPOs.
SpaceX has evolved far beyond a traditional rocket manufacturer. It operates as a vertically integrated aerospace and connectivity ecosystem, combining reusable rocket technology, satellite infrastructure, and global internet services. Its Starlink division remains the core revenue driver, serving millions of users worldwide and expanding rapidly into underserved regions including rural, maritime, and aviation connectivity. In 2025, SpaceX generated an estimated 18.7 billion dollars in revenue, with Starlink contributing the majority share. Growth in subscriber numbers and improving operational efficiency have strengthened its position as a global internet infrastructure competitor.
Beyond space and communications, SpaceX has expanded into artificial intelligence integration through its absorption of xAI, which was reorganized into an internal AI division in 2026. This development positions the company as both a space infrastructure leader and an emerging AI-powered systems operator. The AI segment is focused on autonomous flight systems, satellite optimization, and mission planning tools. However, this expansion has also increased financial pressure, with reported net losses in 2025 reaching approximately 4.94 billion dollars and significant monthly cash burn linked to AI infrastructure scaling. Despite this, the company continues to treat these costs as long-term strategic investments.
The valuation history of SpaceX highlights rapid growth across private funding cycles. From roughly 74 billion dollars in 2021, the company rose to around 350 billion in late 2024, then 800 billion in 2025 private transactions, and approximately 1.25 trillion in early 2026 funding rounds. The current IPO narrative of 1.75 trillion reflects continued investor optimism around Starlink expansion, reusable launch dominance, and future AI-space integration. This trajectory represents one of the fastest valuation escalations in private market history.
The IPO reference price is set at 135 dollars per share with roughly 555.6 million shares offered. At this level, SpaceX would rank among the largest public companies globally and surpass Tesla in market capitalization based on current projections. Elon Musk’s combined holdings, including equity and options, could reach an estimated valuation near 688 billion dollars if post-IPO pricing holds, further amplifying global attention on this listing.
Through Gate Direct IPO Access, users can participate using USDT with a minimum entry threshold of 100 USDT. This significantly lowers traditional barriers that typically require institutional access or high-net-worth investor status. The subscription price is based on the 135 dollar reference level with an additional 5 percent fee, bringing the effective cost to approximately 141.75 USDT per share. The maximum subscription limit per user is set at 500,000 USDT. Importantly, there is no lock-up period, meaning allocated shares become tradable immediately after distribution.
The subscription system uses a time-weighted allocation model. Users who commit funds earlier and maintain their position throughout the full subscription window gain higher allocation weight compared to late participants. The subscription window runs for approximately 66 hours, and the average locked balance across this period determines final allocation strength. Early participation therefore plays a critical role in maximizing potential share distribution.
After the subscription period ends, allocations are expected to be distributed shortly after closing, with trading activation following on the same day through the Gate stock interface. This allows users to transition directly from subscription to secondary market trading within the same ecosystem, reducing friction typically associated with IPO participation across multiple platforms.
It is important to note that this is an intent-based subscription model. Final allocations depend on total demand and the quota secured by Gate from underwriters. Investors may receive full, partial, or no allocation depending on oversubscription levels. If the final IPO price remains within a 20 percent range of the reference price, allocations proceed automatically. Larger deviations may trigger additional confirmation steps to protect investor consent.
Secondary market indicators show varied pricing expectations. Some private trading venues place SpaceX shares around 144.94 dollars, indicating strong demand ahead of listing, while others show lower quotes near 115 dollars depending on liquidity conditions. These differences reflect fragmented private market pricing rather than official IPO valuation.
Analyst opinions remain divided. Some research estimates suggest a fair value closer to 780 billion dollars, arguing that current projections may be aggressive given ongoing losses and execution risks. Others remain bullish, citing long-term opportunities in global satellite internet, AI infrastructure, deep space logistics, and future interplanetary transport systems. SpaceX’s projected total addressable market is often discussed in multi-trillion-dollar terms, driven largely by Starlink expansion and AI-enabled space systems.
A key structural factor is the limited public float, estimated at around 3 percent of total shares. This restricted supply combined with strong institutional and retail demand creates a potentially volatile post-listing environment. Additionally, inclusion expectations in major indices such as Nasdaq 100 within weeks of listing could generate passive fund inflows, adding further demand pressure.
For participation on Gate, users must complete identity verification before the subscription window opens. Funds must be available in USDT without leverage or borrowed capital. Subscription is executed through the Direct IPO Access section, where users select SpaceX, enter their desired amount, and confirm intent. The minimum allocation unit is 0.01 shares, ensuring fractional participation even for smaller investors.
This IPO represents a significant moment in the evolution of public market access. SpaceX combines aerospace engineering, global communications infrastructure, and artificial intelligence development into a single ecosystem, making it one of the most complex and ambitious companies ever to reach public markets. At the same time, it carries meaningful risks due to ongoing losses, aggressive expansion, and uncertain long-term profitability timelines. Investors are encouraged to evaluate both growth potential and downside risk carefully before participation.
The subscription window opens on June 9 at 18:00 UTC+8 and closes on June 12 at 12:00 UTC+8. Every hour of participation affects allocation weight, making timing an important factor. This is a rare opportunity in a high-demand offering where early engagement may significantly influence final results.
Gate直通IPO认购SpaceX
#Gate直通IPO认购SpaceX
@Gate_Square
repost-content-media
  • Reward
  • 1
  • Repost
  • Share
HighAmbition:
good information 👍👍
#OpenAIFilesConfidentialIPO
OpenAI has officially submitted a confidential draft registration statement to the U.S. Securities and Exchange Commission (SEC) for a future Initial Public Offering (IPO), marking one of the most significant developments in the global technology sector in recent years. While the company has not announced a final listing date, the filing confirms that preparations for a public market debut are underway.
The announcement immediately attracted attention across stock markets, venture capital circles, artificial intelligence industries, and cryptocurrency communities.
HighAmbition
#OpenAIFilesConfidentialIPO
OpenAI has officially submitted a confidential draft registration statement to the U.S. Securities and Exchange Commission (SEC) for a future Initial Public Offering (IPO), marking one of the most significant developments in the global technology sector in recent years. While the company has not announced a final listing date, the filing confirms that preparations for a public market debut are underway.
The announcement immediately attracted attention across stock markets, venture capital circles, artificial intelligence industries, and cryptocurrency communities. Investors understand that OpenAI is no longer just another technology company. It has become one of the most influential organizations shaping the future of artificial intelligence, automation, digital productivity, and next-generation computing infrastructure.
Understanding OpenAI's Extraordinary Growth
OpenAI is the company behind ChatGPT, GPT language models, advanced reasoning systems, AI agents, multimodal technologies, and enterprise AI solutions used by businesses around the world.
What makes OpenAI different from many technology startups is the speed of its expansion. In only a few years, the company transformed from a research-focused organization into a global commercial powerhouse.
Recent reports suggest OpenAI reached approximately $2 billion in monthly revenue during early 2026, while annualized revenue surpassed $25 billion. At the same time, private market valuations climbed from around $500 billion in late 2025 to more than $830 billion during 2026.
Some analysts now believe OpenAI could target a public valuation approaching $1 trillion if market conditions remain favorable.
If achieved, this would place OpenAI among the most valuable technology companies ever introduced to public markets.
Current Secondary Market Pricing
Interest in OpenAI shares has already intensified before any official IPO pricing announcement.
On private secondary trading venues, OpenAI shares have recently traded around $1,350 per share, reflecting strong investor demand and expectations for future growth.
Although secondary market pricing does not guarantee the eventual IPO valuation, it provides insight into how sophisticated investors currently view the company's long-term potential.
Many institutional investors are willing to pay significant premiums for exposure to artificial intelligence because they view AI as a technological revolution comparable to the rise of the internet, smartphones, and cloud computing.
What Is a Confidential IPO Filing?
A confidential IPO filing allows a company to submit financial documents and registration materials to regulators without immediately releasing all information to the public.
This process provides several advantages.
First, management can receive feedback from regulators before publishing detailed financial statements.
Second, potential issues can be addressed privately without creating unnecessary market speculation.
Third, executives gain flexibility regarding timing, pricing, and offering structure.
OpenAI has reportedly selected Goldman Sachs and Morgan Stanley to help manage the IPO process, highlighting the scale and importance of the planned listing.
Why OpenAI May Still Prefer Remaining Private for Now
Although OpenAI has started the IPO process, company leadership has indicated that remaining private still provides strategic advantages.
Artificial intelligence remains one of the most competitive sectors in the world. Product development cycles are accelerating, infrastructure spending continues rising, and competitive pressures from rivals remain intense.
Remaining private allows management to make long-term decisions without facing quarterly earnings pressure from public shareholders.
The confidential filing therefore provides flexibility. OpenAI can continue evaluating market conditions while preparing for a possible future listing.
The Microsoft Connection
One of the most important aspects of the OpenAI story is its relationship with Microsoft.
Microsoft remains one of OpenAI's largest strategic partners and investors. Following corporate restructuring efforts, Microsoft controls approximately 27% of the restructured organization.
This partnership extends beyond financial investment.
Microsoft Azure powers much of OpenAI's infrastructure, while OpenAI technologies have become deeply integrated across Microsoft's software ecosystem.
If OpenAI successfully enters public markets and continues growing rapidly, Microsoft's position within the AI sector could become even stronger.
For investors, this creates a situation where both OpenAI and Microsoft may benefit simultaneously from increasing enterprise adoption of artificial intelligence.
The Race Toward AI Dominance
OpenAI is not alone.
The global AI race has intensified dramatically.
Major competitors continue investing billions of dollars into advanced models, infrastructure, and enterprise services.
Anthropic, another leading AI company, has also begun preparations for a public listing. Technology giants including Microsoft, Google, Amazon, Meta, Nvidia, and others continue expanding their AI initiatives.
This means the next few years could become one of the largest investment cycles in technology history.
Just as the internet created trillion-dollar opportunities during previous decades, artificial intelligence may generate a new generation of market leaders.
Potential Impact on Cryptocurrency Markets
The cryptocurrency market is watching these developments closely.
Historically, major shifts in investor capital often influence digital assets.
When large growth opportunities emerge in traditional financial markets, institutional investors sometimes rebalance portfolios and move capital toward sectors expected to deliver stronger risk-adjusted returns.
If OpenAI launches one of the largest IPOs ever seen, significant capital could temporarily flow toward AI-related equities.
This may reduce short-term liquidity available for speculative cryptocurrency investments.
Such capital rotation has occurred during previous periods when investors shifted focus toward emerging technology themes.
However, the story is not entirely negative for crypto.
Why AI-Themed Crypto Assets Could Benefit
Artificial intelligence and blockchain technologies are increasingly intersecting.
Many blockchain projects now focus on decentralized computing networks, AI training infrastructure, autonomous AI agents, decentralized data marketplaces, and machine-learning services.
As OpenAI receives more media coverage, public interest in artificial intelligence is likely to increase.
This increased attention may encourage investors to explore AI-related cryptocurrency projects as alternative ways to gain exposure to the broader AI narrative.
Historically, strong narratives attract capital.
When artificial intelligence becomes the dominant conversation across global markets, AI-focused digital assets often experience higher trading volumes, stronger community engagement, and renewed investor interest.
Could OpenAI Become the Largest IPO in Modern History?
This is one of the biggest questions investors are asking.
If OpenAI reaches a valuation near $1 trillion, it would challenge records set by some of the most significant technology listings in history.
The combination of explosive revenue growth, global brand recognition, enterprise adoption, strategic partnerships, and leadership within artificial intelligence makes OpenAI unique.
Few companies have achieved this level of influence before becoming publicly traded.
The market will closely examine future disclosures regarding revenue growth, operational expenses, infrastructure spending, margins, and long-term profitability.
The Importance of AI Infrastructure Spending
One issue investors cannot ignore is cost.
Artificial intelligence requires enormous computational resources.
Training and operating advanced models involves large expenditures on data centers, specialized chips, energy, networking equipment, and cloud infrastructure.
While OpenAI's revenue growth remains impressive, investors will also focus heavily on operational efficiency and the path toward sustainable profitability.
The company's ability to balance rapid expansion with financial discipline could become one of the most important factors influencing long-term valuation.
Possible Market Scenarios
Bullish Scenario (70%)
OpenAI proceeds toward a successful IPO, investor demand remains extremely strong, valuation approaches $1 trillion, AI-related equities rally, AI-themed crypto assets gain attention, and overall market sentiment improves.
Neutral Scenario (20%)
The IPO progresses successfully but valuation expectations moderate. Traditional markets absorb the offering smoothly while cryptocurrency markets experience only limited impact.
Bearish Scenario (10%)
Market conditions weaken before listing, investor demand softens, valuation expectations decline, and risk assets including growth stocks and speculative crypto sectors face temporary pressure.
My View
I believe OpenAI's confidential IPO filing represents a historic milestone for artificial intelligence and financial markets.
The company has already transformed how businesses, developers, and consumers interact with technology. A public listing would provide unprecedented transparency into one of the world's most influential AI organizations.
For cryptocurrency investors, the short-term effect may involve competition for capital as institutions evaluate opportunities within AI equities. However, over the longer term, greater awareness of artificial intelligence could benefit blockchain projects connected to AI infrastructure, decentralized computing, data networks, and autonomous agent ecosystems.
The key factor to monitor is capital flow. If AI becomes the dominant investment narrative of 2026 and 2027, both traditional equities and selected AI-focused crypto assets could attract substantial investor attention.
OpenAI's journey toward a public listing is no longer speculation. The process has officially begun, and the consequences could extend far beyond Wall Street, influencing technology, artificial intelligence, venture capital, and cryptocurrency markets worldwide for years to come.@Gate_Square #CreatorCarnival
repost-content-media
  • Reward
  • 1
  • Repost
  • Share
HighAmbition:
good information 👍👍
#ShareYourUSStocksWinNvidia
#MU
Micron Technology has experienced remarkable price movement recently, climbing from approximately 938 to 992, representing a significant upward momentum. The stock closed at 949.28 on June 8, 2026, following a volatile session that saw the price swing between 916.50 and 962.82. This movement demonstrates the high volatility characteristic of MU, which carries a beta of 2.17, indicating it moves roughly twice as much as the broader market.
Key Support and Resistance Levels
Based on technical analysis, the critical support level for MU stands at approximately 812
US5000.58%
US500200.58%
HighAmbition
#ShareYourUSStocksWinNvidia
#MU
Micron Technology has experienced remarkable price movement recently, climbing from approximately 938 to 992, representing a significant upward momentum. The stock closed at 949.28 on June 8, 2026, following a volatile session that saw the price swing between 916.50 and 962.82. This movement demonstrates the high volatility characteristic of MU, which carries a beta of 2.17, indicating it moves roughly twice as much as the broader market.
Key Support and Resistance Levels
Based on technical analysis, the critical support level for MU stands at approximately 812.78, while immediate resistance is positioned around 915.25. However, given the current price action near 992, traders should monitor the psychological 1000 level as a major resistance zone. Heavy call option concentrations exist at 900 and 1000 strike prices, which often creates natural resistance due to profit-taking and pinning effects around these levels.
The long-term moving average support sits near 712.88, providing a substantial safety net should the stock experience a deeper correction. For short-term traders, the 900 level now acts as immediate support following the recent breakout.
Price Forecast and Upside Potential
Analysts project significant upside potential for Micron over the next three months. Statistical models suggest the stock could rise approximately 136.59% during this period, with price targets ranging between 1,819.60 and 2,601.81 by the end of the three-month horizon. This forecast carries a 90% probability confidence interval.
The bullish thesis rests on several fundamental factors. Micron operates in the memory chip sector, where artificial intelligence demand is consuming nearly all production capacity, causing prices to soar. Revenue has grown dramatically from 13.6 billion two quarters ago to 23.9 billion in the latest quarter, with projections of 33.5 billion for the upcoming quarter. Wall Street analysts expect even stronger performance, forecasting 33.8 billion in revenue representing 263% year-over-year growth.
Trading Strategy Recommendations
For traders considering entry at current levels near 992, several strategic approaches merit consideration. The first approach involves waiting for a pullback toward the 900 support level before initiating long positions. This entry point offers favorable risk-reward dynamics with a clear stop-loss placement below 880.
Alternatively, aggressive traders might consider partial entries at current levels with additional accumulation on any dips toward 920-930. This scaling approach helps manage volatility while maintaining exposure to potential upside momentum.
Risk management remains paramount given MU's high beta. Position sizing should account for the stock's tendency to move 11-13% in single sessions, as witnessed recently when the stock declined 13.25% on June 5 before recovering 9.87% on June 8.
Upcoming Catalysts
Micron announces its fiscal third quarter 2026 earnings on June 24, representing a significant catalyst event. Analysts expect the company to beat guidance and potentially announce guidance exceeding 40 billion for the next quarter. A strong beat-and-raise quarter could trigger substantial post-earnings appreciation, with some analysts suggesting the stock remains undervalued at current levels despite the recent rally.
The forward price-to-earnings ratio sits below 16, which appears attractive compared to the S&P 500's 21.8 multiple. When looking at fiscal year 2027 projections, the valuation drops to less than 9 times forward earnings, suggesting significant upside if the AI-driven memory demand cycle persists as expected through 2030.
Technical Outlook
The stock currently holds a mixed technical signal profile. Short-term moving averages generate sell signals following the rapid ascent, while long-term averages maintain buy signals. Since the short-term average remains above the long-term average, the overall technical picture remains constructive for long positions.
The relative strength index likely sits in overbought territory following the 26.4% gain over the past two weeks, suggesting potential for short-term consolidation before the next leg higher. However, in strongly trending markets, overbought conditions can persist longer than anticipated.
Conclusion
Micron Technology presents a compelling trading opportunity with substantial upside potential driven by AI-related memory demand. Current price action near 992 offers limited immediate upside to the 1000 resistance, making patience for pullbacks toward 900-920 advisable for new entries. The upcoming June 24 earnings report represents a critical catalyst that could either accelerate the uptrend or trigger profit-taking. Traders should maintain disciplined risk management given the stock's elevated volatility profile and position size accordingly.
@Gate_Square #CreatorCarnival
repost-content-media
  • Reward
  • 1
  • Repost
  • Share
HighAmbition:
thnxx for the update
#StrategyAdds1550BTCatLowerPrices
Strategy, the largest corporate holder of Bitcoin, has recently made a significant move by acquiring 1,550 Bitcoin for approximately $101 million at an average price of $65,332 per coin. This purchase represents a strategic accumulation during a market downturn and carries multiple implications for the broader cryptocurrency market.
Point One: The Scale of Purchase
Strategy purchased 1,550 Bitcoin between June 1 and June 7, 2026, investing approximately $101.3 million. This acquisition increased the company's total Bitcoin holdings to 845,256 BTC. The purchas
HighAmbition
#StrategyAdds1550BTCatLowerPrices
Strategy, the largest corporate holder of Bitcoin, has recently made a significant move by acquiring 1,550 Bitcoin for approximately $101 million at an average price of $65,332 per coin. This purchase represents a strategic accumulation during a market downturn and carries multiple implications for the broader cryptocurrency market.
Point One: The Scale of Purchase
Strategy purchased 1,550 Bitcoin between June 1 and June 7, 2026, investing approximately $101.3 million. This acquisition increased the company's total Bitcoin holdings to 845,256 BTC. The purchase is particularly notable because it is nearly 50 times the amount the company sold just one week prior, when it liquidated 32 Bitcoin for $2.5 million to cover preferred stock dividend obligations. This demonstrates that the brief sale was a structural financial necessity rather than a loss of conviction in Bitcoin's long-term value.
Point Two: Strategic Timing at Lower Prices
The acquisition was executed at an average price of $65,332 per Bitcoin, which sits significantly below Strategy's overall average acquisition cost of $75,680. This marks the first time the company has successfully lowered its average purchase cost through a buy-the-dip strategy. By purchasing during a period of market weakness, Strategy is employing a classic dollar-cost averaging approach that improves its overall position cost basis and enhances potential future returns when prices recover.
Point Three: Funding Mechanism
To fund this acquisition, Strategy issued approximately 1.41 million shares of its Class A common stock, raising $181 million in net proceeds. The company also increased its cash reserves by $100 million, bringing total cash on hand to $1 billion. This dual approach of equity issuance and cash reserve management demonstrates disciplined financial planning. The substantial cash position provides Strategy with flexibility to meet its $750-800 million annual preferred dividend obligations while maintaining capacity for future Bitcoin acquisitions.
Point Four: Market Confidence Signal
The purchase sent a powerful message to the market that Strategy's long-term accumulation strategy remains fully intact. Following the rare sale of 32 Bitcoin in late May, which had caused significant psychological impact and contributed to a broader market decline, this substantial buyback helped restore confidence. Executive Chairman Michael Saylor's announcement on social media, accompanied by his signature "add more dots" chart reference, reinforced the company's continued commitment to Bitcoin as its primary treasury reserve asset.
Point Five: Institutional Validation
Large-scale purchases by institutional investors like Strategy serve as validation of Bitcoin's legitimacy as a treasury asset. With over 845,000 Bitcoin in its treasury acquired for nearly $64 billion in total, Strategy's continued accumulation demonstrates institutional conviction in Bitcoin's long-term store of value proposition. This type of institutional activity often encourages other corporate treasuries and institutional investors to consider similar allocations, potentially creating a positive feedback loop of adoption and demand.
Point Six: Impact on Market Sentiment
Strategy's purchase occurred during a period when Bitcoin had fallen below $60,000 for the first time since late 2024, representing a decline of over 40 percent from its all-time high of $126,198 reached in October 2025. The timing of this purchase at lower prices may encourage other investors to view the current market weakness as an accumulation opportunity rather than a reason for panic selling. When major institutional players buy during downturns, it often signals to retail and smaller institutional investors that the asset remains fundamentally sound.
Point Seven: Cost Averaging Benefits
By purchasing at $65,332 compared to their historical average of $75,680, Strategy has effectively reduced its blended acquisition cost. This improves the company's risk-adjusted return profile and positions it better for when Bitcoin prices eventually recover. The strategy of buying more when prices are lower is a fundamental principle of sound investment management, and Strategy's execution of this approach demonstrates sophisticated treasury management.
Point Eight: Long-Term Outlook and Risk Considerations
While this purchase is a positive signal, it is important to recognize that Bitcoin's price trajectory depends on multiple factors beyond any single company's actions. The company currently holds an unrealized position that is approximately $11.7 billion underwater at current prices, highlighting the volatility inherent in Bitcoin investments. However, Strategy's continued accumulation suggests management maintains strong conviction in Bitcoin's long-term appreciation potential, with many analysts projecting prices could reach $120,000 to $150,000 or higher in the coming years.
Current Bitcoin Price and Technical Analysis
As of June 10, 2026, Bitcoin is trading at approximately $61,776. The cryptocurrency has experienced significant volatility, having fallen from its all-time high of $126,073 in October 2025. Technical analysis indicates several critical price levels that traders should monitor.
Key Support Levels
The most significant support zone currently lies between $60,000 and $62,000. This range represents a crucial technical cluster where substantial Bitcoin volumes have historically changed hands. The $60,000 level is particularly important as it acted as major resistance during the 2021 cycle and later became a floor during early 2026 volatility. A sustained break below $60,000 could signal a more significant bearish shift in market structure.
Additional support is found around $58,000, which represents a tighter range boundary. The $50,000 level has been cited by some analysts, including Standard Chartered, as a potential target if weak momentum, ETF outflows, and macroeconomic pressure continue.
Key Resistance Levels
On the upside, immediate resistance is expected around $64,800, which represents a 38.2 percent Fibonacci retracement level. The next significant resistance zone lies between $98,500 and $106,000, with the upper Bollinger Band providing dynamic resistance around $106,000. The psychological $100,000 level remains a major milestone that would likely attract significant attention and potentially trigger renewed bullish momentum.
Trading Strategy Considerations
For traders and investors analyzing this market environment, several strategic approaches emerge from the current conditions. First, the presence of institutional buying at current levels suggests that accumulation strategies may be appropriate for those with long-term investment horizons. Dollar-cost averaging into positions during periods of weakness has proven effective for institutional players like Strategy.
Second, risk management remains essential given the elevated volatility. Position sizing should account for the possibility of further downside, with the $60,000 level serving as a critical line in the sand for bullish market structure. A break below this level could invalidate the current bull market narrative and warrant a reassessment of positioning.
Third, traders should monitor institutional flows, particularly ETF activity and corporate treasury purchases, as these have become significant drivers of Bitcoin price action. The $4 billion in outflows from U.S. spot ETFs since mid-May has contributed to recent weakness, and a reversal in these flows could signal improving conditions.
Price Forecast and Market Outlook
Analysts maintain varied outlooks for Bitcoin's price trajectory. Conservative projections suggest Bitcoin could settle around $68,766 to $78,448 in the second half of 2026, while more optimistic forecasts target $120,000 to $150,000 over the next 12 months. Long-term projections for 2030 range from $209,555 to $297,128, with some analysts envisioning prices reaching $1 million or higher in the coming decades.
The current market structure suggests Bitcoin is undergoing a correction within a broader bull market cycle. Elliott Wave analysis indicates the market is completing wave four of a five-wave impulse pattern, with potential for recovery once this correction concludes. However, the timing and magnitude of any recovery will depend on macroeconomic conditions, regulatory developments, and continued institutional adoption.
Market Sentiment and Trader Psychology
Current market sentiment reflects caution following the significant drawdown from all-time highs. Short sellers have reportedly lost substantial amounts, with some estimates suggesting $504 million in losses on recent Bitcoin rebounds. This short squeeze dynamic can create rapid price movements when sentiment shifts.
Michael Saylor has attributed recent weakness to capital rotation into artificial intelligence infrastructure, noting approximately $400 billion deployed into AI over the past six months. This rotation narrative suggests Bitcoin's decline may be temporary rather than structural, as institutional capital reallocates between emerging technology sectors.
Conclusion
Strategy's purchase of 1,550 Bitcoin at lower prices represents a significant vote of confidence in the cryptocurrency's long-term prospects. The company's ability to lower its average acquisition cost while maintaining substantial cash reserves demonstrates sophisticated treasury management. For traders and investors, this institutional activity provides valuable insight into how major market participants are positioning during the current market cycle.
While risks remain, including macroeconomic headwinds and regulatory uncertainty, the continued institutional accumulation of Bitcoin suggests the asset class is maturing. Traders should monitor key support levels at $60,000 and $58,000 while watching for resistance breaks above $64,800 and $100,000 as potential catalysts for the next major price movement.@Gate_Square #StrategyAdds1550BTCatLowerPrices #StrongNonfarmPayrollsRekindleRateHikeFear #IranAttacksIsrael
repost-content-media
  • Reward
  • 1
  • Repost
  • Share
HighAmbition:
good information 👍👍👍
#GateIPOAccessSpaceX
Gate has introduced IPO Access, a feature that allows eligible users to participate in selected global initial public offerings directly through the platform. Instead of opening separate brokerage accounts, completing multiple verification procedures, or transferring funds between different financial institutions, investors can subscribe from a single account and receive allocated shares after listing. The first featured project is SpaceX, with subscriptions starting from 100 USDT and a maximum limit of 500,000 USDT per user.
Point 1: SpaceX Subscription Momentum
One of t
SPCX2.38%
HighAmbition
#GateIPOAccessSpaceX
Gate has introduced IPO Access, a feature that allows eligible users to participate in selected global initial public offerings directly through the platform. Instead of opening separate brokerage accounts, completing multiple verification procedures, or transferring funds between different financial institutions, investors can subscribe from a single account and receive allocated shares after listing. The first featured project is SpaceX, with subscriptions starting from 100 USDT and a maximum limit of 500,000 USDT per user.
Point 1: SpaceX Subscription Momentum
One of the strongest indicators of investor interest is the rapid growth in subscription demand. The SpaceX IPO Access campaign has already attracted approximately 30 million USDT in intended subscriptions, demonstrating significant market participation even before the deadline. Such demand reflects strong confidence from both crypto-native investors and traditional market participants.
Point 2: Subscription Price and Valuation
The intended subscription price has been announced at 135 USDT per share. If market demand remains strong after listing, investors may expect increased price volatility during the early trading sessions. However, IPO prices do not guarantee future market performance, and values can move both above and below the subscription level depending on investor sentiment.
Point 3: Low Entry with High Flexibility
Starting from only 100 USDT, the offering allows smaller investors to participate without committing substantial capital. At the same time, the maximum subscription cap of 500,000 USDT enables institutional-sized participants to seek meaningful exposure. This wide participation range improves accessibility while supporting overall market liquidity.
Point 4: Liquidity and Trading Efficiency
Once allocated shares are transferred into Gate stock accounts, users can trade within the platform without moving assets to another broker. This integrated structure may improve trading efficiency and provide faster access to liquidity after listing. Higher trading activity generally results in tighter spreads and smoother execution for buyers and sellers.
Point 5: Volume Indicates Market Interest
Large subscription volume often reflects growing investor confidence. A 30 million USDT subscription pool before listing suggests substantial attention from the market. High participation can create active trading conditions after listing, although increased activity may also lead to larger short-term price swings.
Point 6: Allocation Mechanics
When subscription demand exceeds available shares, allocation becomes an important factor. If the offering is significantly oversubscribed, investors may receive only a percentage of their requested amount rather than the full allocation. This process ensures a broader distribution among participants while maintaining fairness.
Point 7: Early Participation Advantage
Earlier participation may improve allocation weight depending on platform methodology and total demand. As subscription volume increases closer to the deadline, competition for available shares can intensify. Investors who subscribe earlier may therefore benefit from a stronger allocation position compared with last-minute participants.
Point 8: Risk Versus Potential Reward
IPO investments can generate attractive returns if post-listing demand remains strong. For example, if shares appreciate by 10%, 20%, or even 30% after listing, subscribers may realize gains depending on their allocation size. However, prices can also decline by similar percentages if market sentiment weakens, making disciplined risk management essential.
Point 9: SpaceX's Market Appeal
SpaceX continues to attract global attention because of its achievements in reusable rocket technology, satellite deployment, and commercial space exploration. Investor optimism surrounding innovation often contributes to stronger subscription demand and elevated trading volume during the initial listing period.
Point 10: Impact on Digital Asset Investors
Gate IPO Access represents a significant step toward combining cryptocurrency infrastructure with traditional equity markets. Crypto users who previously focused only on digital assets can now diversify into IPO opportunities without leaving the platform, creating a more balanced investment ecosystem.
Point 11: Liquidity, Demand, and Price Discovery
Strong liquidity and healthy trading volume are essential for efficient price discovery. If post-listing demand remains elevated, buying pressure could support higher valuations. Conversely, heavy selling from early participants may temporarily increase volatility before prices stabilize. Investors should expect fluctuations during the first trading sessions.
Point 12: Long-Term Perspective
While the current subscription price is 135 USDT and intended subscriptions have already reached around 30 million USDT, long-term success will depend on SpaceX's business performance, broader market conditions, investor confidence, and future growth expectations. IPO participation should be viewed as part of a diversified strategy rather than a guaranteed source of profit.
Market Outlook
The combination of a 100 USDT minimum investment, a 500,000 USDT maximum subscription limit, approximately 30 million USDT in demand, and a 135 USDT intended subscription price highlights the scale of interest surrounding this offering. High liquidity, strong participation volume, and significant investor attention could create active trading conditions after listing, but volatility should also be expected. Investors should evaluate allocation risks, monitor market conditions, and avoid committing capital beyond their personal risk tolerance while considering both short-term opportunities and long-term objectives.
@Gate_Square
repost-content-media
  • Reward
  • 1
  • Repost
  • Share
HighAmbition:
good information 👍
#StrongNonfarmPayrollsRekindleRateHikeFear
The May 2026 Non-Farm Payroll report just detonated across global markets, and the fallout is reshaping everything from Federal Reserve policy expectations to crypto valuations. The U.S. economy added 172,000 jobs in May, more than double the 85,000 that economists had forecast. April's figure was revised upward to 179,000, marking the strongest three-month hiring streak in over two years. The unemployment rate held flat at 4.3%, and average hourly earnings climbed 0.3% month-over-month, keeping wage pressure firmly in the picture. This was not just
HighAmbition
#StrongNonfarmPayrollsRekindleRateHikeFear
The May 2026 Non-Farm Payroll report just detonated across global markets, and the fallout is reshaping everything from Federal Reserve policy expectations to crypto valuations. The U.S. economy added 172,000 jobs in May, more than double the 85,000 that economists had forecast. April's figure was revised upward to 179,000, marking the strongest three-month hiring streak in over two years. The unemployment rate held flat at 4.3%, and average hourly earnings climbed 0.3% month-over-month, keeping wage pressure firmly in the picture. This was not just a beat; it was a blowout that instantly rewrote the macro narrative. Here are the six critical dimensions of this unfolding story.
Point 1: The Non-Farm Payroll Shock and What the Numbers Mean
When the Bureau of Labor Statistics released the May report on June 5, the market was bracing for a modest 85,000 job additions, which would have signaled a cooling labor market and given the Fed room to ease. Instead, 172,000 jobs materialized, and the prior two months were revised upward by a combined 64,000. This means the economy added an average of over 150,000 jobs per month across the last three months, a pace consistent with a healthy, expanding labor market rather than one that needs stimulus. The unemployment rate at 4.3% is historically low, and wage growth at 0.3% monthly translates to an annualized pace above 3.5%, meaning workers are still seeing real income gains. For a Federal Reserve that has been cautiously holding rates at 3.50%-3.75%, this data screams that the economy does not need rate cuts; if anything, it might need more restraint. The immediate market reaction was violent. Two-year Treasury yields, which are the most sensitive to Fed policy expectations, surged 11 basis points to 4.15%, the highest level this year. The dollar index rocketed to a two-month peak. Gold cratered more than 3% in a single session, its worst daily drop since March, with spot gold falling to $4,287 per ounce and gold futures settling at $4,353. The message from the data was clear: the labor market is not breaking down, it is breaking out.
Point 2: Fed Rate Hike Probability and How It Has Surged
Before the NFP release, CME's FedWatch tool showed roughly a 52% probability of a rate hike by December 2026. Within hours of the report, that probability jumped to 68.4%, and by Monday June 8, it had climbed above 70%. Some analysts at major banks now project the Fed could deliver two 25 basis-point hikes later this year, responding to both the labor market re-acceleration and the inflationary pressures from the ongoing Iran conflict driving oil prices above $100 per barrel. Goldman Sachs has officially scrapped its forecast for any rate cut in 2026 and pushed its first cut prediction to June 2027, with a second cut expected in December 2027. The brokerage's reasoning is telling: resilient activity and employment data lower the bar for a rate hike not because the economy is overheating, but because a stronger starting point reduces the risk that a hike could end up looking like a costly mistake. For the June FOMC meeting, the probability of holding rates steady at 3.50%-3.75% stands at 96.4%, effectively ruling out any immediate move. But the December timeline is where the real fear now lives. The shift from expecting rate cuts to pricing in rate hikes is a seismic reversal. Just weeks ago, markets were debating whether the Fed would cut once or twice this year. Now, the conversation has flipped to whether there will be one hike or two. This reversal is what the hashtag StrongNonfarmPayrollsRekindleRateHikeFear encapsulates: the fear that the Fed, seeing a resilient economy and rising inflation pressures from energy costs, may actually tighten further rather than loosen.
Point 3: What Rekindled Rate Hike Fear Means in Practical Terms
Rate hike fear is not just an abstract macro concept. It translates directly into tighter financial conditions across every asset class. When the market prices in higher future rates, the cost of borrowing increases immediately through the bond market, even before the Fed actually moves. Corporate bond yields rise, mortgage rates climb, and the discount rate applied to future earnings on equities and future cash flows on speculative assets like crypto increases. This means every asset that depends on cheap liquidity gets repriced downward. The dollar strengthens as foreign capital chases higher U.S. yields, draining liquidity from emerging markets and risk assets globally. Gold, which benefits from low real rates, gets hammered because higher nominal rates without offsetting inflation compression push real yields up. The two-year yield at 4.15% combined with inflation still running above target means real short-term rates are meaningfully positive, a hostile environment for zero-yield assets like gold and Bitcoin. For crypto specifically, the mechanism is brutal. Higher rates mean a stronger dollar, which historically correlates inversely with Bitcoin price action. Higher rates also mean reduced appetite for leveraged speculation, which is the engine that has driven crypto rallies in every cycle. When the cost of carry on leveraged positions rises and the macro backdrop signals that cheap money is not coming back, speculators unwind positions en masse, which is exactly what we witnessed on June 5.
Point 4: The Crypto Market Carnage and Key Price Levels
The crypto market has been under siege for weeks, and the NFP shock turned pressure into a full-blown rout. Bitcoin fell 17.3% over the week ending June 6, its worst weekly performance since the FTX collapse in November 2022. BTC touched a low below $60,000 on Friday, briefly hitting $59,800 before recovering to approximately $61,300 over the weekend. As of June 9, Bitcoin is trading around $62,640, still nursing severe losses from a peak above $126,000 in October 2025. That peak-to-current decline represents more than a 50% drawdown from the cycle high. Ethereum suffered even more, dropping 22% over the same week, with ETH falling to approximately $1,658 on June 5 before edging back toward the $1,700 range. ETH's underperformance versus BTC reflects the higher beta nature of altcoins in a risk-off environment. Solana edged down to around $65.88 with marginal recovery. XRP held relatively better at approximately $1.15, showing only modest declines. The total crypto market capitalization shed approximately $390 billion during the week, leaving total market cap hovering just above $2 trillion. Bitcoin open interest fell 22.7% to $46.27 billion, and Ethereum open interest dropped 26.6% to $25.06 billion, indicating massive deleveraging. Approximately $7 billion in leveraged positions were liquidated across the week, with $1.5 billion in long liquidations cascading on the day of the NFP release alone. The liquidation cascade briefly pushed Bitcoin below $60,000 for the first time since October 2024, a psychologically devastating level that erased the entire post-Trump election rally narrative.
Point 5: How Institutional Flows and ETF Dynamics Amplified the Damage
The NFP shock did not act alone. It landed on a crypto market already weakened by unprecedented ETF outflows and institutional capitulation. Spot Bitcoin ETFs had been on a 12-day consecutive outflow streak totaling $3.58 billion before the NFP release, and the payroll data accelerated that drain. The Coinbase Premium Index, which measures the difference between BTC prices on Coinbase versus offshore exchanges, plunged to -0.15%, meaning U.S. institutional buyers were effectively paying less for Bitcoin than global retail participants. This is a clear signal that American institutional demand has evaporated. Strategy, the largest corporate Bitcoin holder, briefly sold 32 BTC between May 26 and May 31, its first-ever Bitcoin sale, which sent shockwaves through the market even though the amount was tiny relative to its total holdings. The psychological impact was disproportionate: if the most committed corporate holder was selling, what did that say about conviction? Strategy later reversed course, purchasing 1,550 BTC between June 1 and June 7 at an average price of $65,332, funded by $181 million in equity sales, attempting to restore confidence. But the damage to sentiment was already done. The combination of persistent ETF outflows, the Strategy sale narrative, and then the NFP-driven rate hike repricing created a three-front assault on crypto valuations. Each factor alone would have caused volatility; together, they produced one of the worst weekly drawdowns in crypto history.
Point 6: What Comes Next and How to Navigate the Rate Hike Fear Era
Looking ahead, the path depends on whether the rate hike fear materializes into actual Fed tightening or remains a market repricing that eventually stabilizes. The June FOMC meeting on June 18 will almost certainly hold rates steady at 3.50%-3.75%, with a 96.4% probability priced in. The real drama begins with the July meeting and beyond. If subsequent employment and inflation data continue to surprise strong, the probability of a December hike will push above 80%, and the market may begin pricing in a July hike as well. That scenario would likely drive Bitcoin toward the $50,000-$55,000 support zone that Standard Chartered has warned about, and could push ETH below $1,500. Conversely, if the next few months of data show cooling, or if the geopolitical energy shock from the Iran conflict stabilizes, rate hike probabilities could retreat, potentially restoring a rate-hold or even rate-cut narrative by late 2026. Goldman Sachs now expects the Fed to wait until 2027 for cuts, meaning the no-cut baseline for the rest of 2026 is the mainstream consensus. For crypto investors, this means the macro headwind is structural and persistent, not transient. The era of rate-cut-driven rallies that powered crypto from late 2023 through early 2025 is over. The new regime demands a different approach: focus on assets and projects with fundamental value rather than pure speculation, manage leverage conservatively because the liquidation cascades are getting more violent, and watch the CME FedWatch probability as the single most important macro signal. A drop in the December hike probability below 50% would signal that the rate hike fear is fading and that a relief rally could materialize. Until that happens, crypto remains under macro pressure, and every strong economic data print will feel like another blow. The StrongNonfarmPayrollsRekindleRateHikeFear story is not a one-day event. It is the beginning of a new macro chapter where the labor market's strength paradoxically becomes the market's greatest threat.@Gate_Square #StrategyAdds1550BTCatLowerPrices
repost-content-media
  • Reward
  • 1
  • Repost
  • Share
HighAmbition:
good information about crypto market
  • Pinned