Dogecoin Holds $0.15: Could a Double Bottom Trigger a Rebound?

Last Updated 2026-03-27 12:19:12
Reading Time: 1m
Dogecoin (DOGE) is currently exhibiting a double bottom formation in the $0.14–$0.15 price zone. If support remains firm and DOGE breaks the neckline, it could trigger a rebound toward $0.20. This piece provides a comparative analysis of technical factors and on-chain metrics.

Recent Price Trends and Support Background


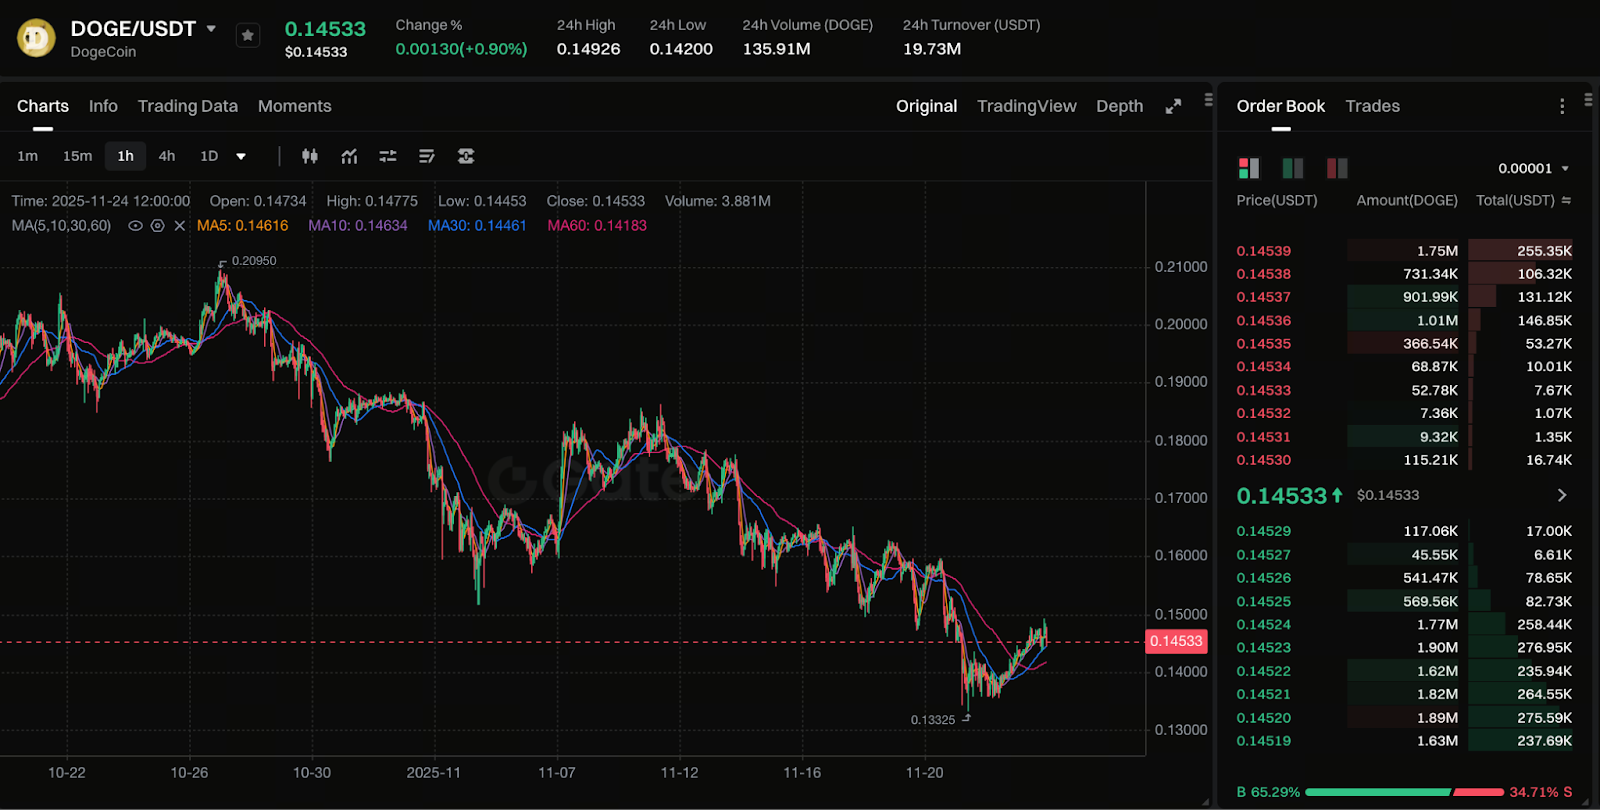
Chart: https://www.gate.com/trade/DOGE_USDT

Dogecoin’s price has recently hovered between $0.14 and $0.15, reflecting focused market sentiment. Leading analysis firms report a clear double bottom pattern forming in this range, with buying interest gradually picking up. Technical analysts warn, however, that if the $0.15 support fails again, prices may drop to a lower demand area. This zone is a critical point for both buyers and sellers.

Double Bottom Pattern: Definition and Significance

In technical analysis, the double bottom pattern is widely considered a reversal signal. When prices hit similar lows twice, rebound between the lows, and then break above the Neckline (the intervening high), it suggests weakening selling pressure and a possible shift to an upward trend.

Currently, market observers are focused on Dogecoin’s activity near $0.14. After the first bottom and its rebound, the price has dipped close to the same level again, indicating a potential second bottom in formation. If the price breaks above the Neckline, bullish momentum may increase, potentially leading to another upward move.

Current Market Structure: Support and Resistance Analysis

From a technical perspective, the $0.14 to $0.15 range remains the core support zone. This range marks both recent lows and prior successful rebounds, where buyers have repeatedly absorbed selling pressure.

For resistance, a break above the Neckline could set a short-term target near $0.20, with stronger resistance likely around $0.26. Conversely, if the $0.15 support is decisively breached, the market may drop back toward $0.135 or lower as it searches for renewed buying interest.

Overall, the structure is at a pivotal stage—decline, bottoming, and potential reversal. The next trend will be shaped by volume shifts, capital flows, and whether key turning points align.

On-Chain Data and Market Sentiment

In addition to chart patterns, on-chain metrics, exchange flows, and derivatives positioning provide insight into evolving market sentiment. Previous analysis indicates that holding above $0.15 could signal accumulation. Analysis Insight +1

Analysts continue to warn that sellers remain dominant and outflows are ongoing. Webull

Market sentiment appears to be shifting, but confirmation is still pending. Bulls should wait for a breakout to be validated.

Potential Rebound Paths and Risk Considerations

If bulls hold the crucial $0.15 support and break above the Neckline (around $0.17–$0.18), Dogecoin could rally toward $0.20, with an extended target near $0.26.

On the other hand, if $0.15 fails, prices may retreat to the $0.135 demand zone or lower, negating the double bottom reversal signal.

At this critical juncture, increased trading volume, sustained rebound strength, and stability after a breakout will be key indicators of the next trend.

Summary: Key Levels for Bulls and Bears

Dogecoin is currently developing a possible double bottom structure in the $0.14–$0.15 range, marking a vital turning point. From a technical standpoint, a bullish breakout above the Neckline could spark a rebound, while a breakdown below support poses further downside risk.

For investors, the prudent strategy is to wait for confirmation of a breakout or clear support before committing, rather than speculating during periods of uncertainty.

Author: Max
Disclaimer
* The information is not intended to be and does not constitute financial advice or any other recommendation of any sort offered or endorsed by Gate.
* This article may not be reproduced, transmitted or copied without referencing Gate. Contravention is an infringement of Copyright Act and may be subject to legal action.

Related Articles

What is Fartcoin? All You Need to Know About FARTCOIN
Intermediate

What is Fartcoin? All You Need to Know About FARTCOIN

Fartcoin (FARTCOIN) is a representative meme coin within the Solana ecosystem based on an AI-driven narrative. Its core concept originated from an experiment aimed at exploring the "boundaries between AI Agents and humor." More than just a digital asset with social attributes, the project deeply couples absurd humor culture with on-chain financial logic by integrating autonomous AI interaction models.
2026-04-04 22:01:19
Gold Price Forecast for the Next Five Years: 2026–2030 Trend Outlook and Investment Implications, Could It Reach $6,000?
Beginner

Gold Price Forecast for the Next Five Years: 2026–2030 Trend Outlook and Investment Implications, Could It Reach $6,000?

Analyze current gold price trends alongside authoritative five-year forecasts, integrating an evaluation of market risks and opportunities. This gives investors insight into the potential trajectory of gold prices and the main drivers expected to shape the market over the next five years.
2026-03-25 18:13:30
Aster vs Hyperliquid: Which Perp DEX Will Prevail?
Beginner

Aster vs Hyperliquid: Which Perp DEX Will Prevail?

Aster and Hyperliquid are the two representative protocols of the "purpose-built L1 path" within the current decentralized perpetual exchange (Perp DEX) sector. As a pioneer in the field, Hyperliquid has built a deep liquidity moat through its highly mature order book architecture and strong community consensus. Conversely, Aster, as a rising challenger, seeks to leapfrog the competition in high-performance trading through more aggressive multi-chain aggregation logic, private transaction modules, and an underlying execution environment optimized for 2026 market demands.
2026-03-24 11:58:33
2026 Silver Price Forecast: Bull Market Continuation or High-Level Pullback? In-Depth Analysis of Silver Candlestick Chart
Beginner

2026 Silver Price Forecast: Bull Market Continuation or High-Level Pullback? In-Depth Analysis of Silver Candlestick Chart

2026 Silver Price Forecast: Latest Outlook This article integrates current market trends, silver candlestick chart analysis, and momentum factors to assess the potential key support and resistance levels, upside targets, and pullback risks for silver prices. The goal is to help investors make informed, rational decisions.
2026-03-25 16:08:59
ASTER Tokenomics: Buybacks, Burns, and Staking as the Value Foundation of ASTER in 2026
Beginner

ASTER Tokenomics: Buybacks, Burns, and Staking as the Value Foundation of ASTER in 2026

ASTER is the native equity and governance token of the Aster ecosystem, with its core value built upon a radical "Deflationary Engine." Beyond serving as a governance tool, ASTER integrates multiple utilities including staking rewards, trading fee discounts, and liquidity incentives. Through its deep integration with the upcoming dedicated Layer 1 mainnet, it enables direct value capture from protocol cash flow to token holders.
2026-03-25 07:38:07
Crypto Future Profit Calculator: How to Calculate Your Potential Gains
Beginner

Crypto Future Profit Calculator: How to Calculate Your Potential Gains

Crypto Future Profit Calculator helps traders estimate potential earnings from futures contracts by considering entry price, leverage, fees, and market movement.
2026-04-03 23:27:09