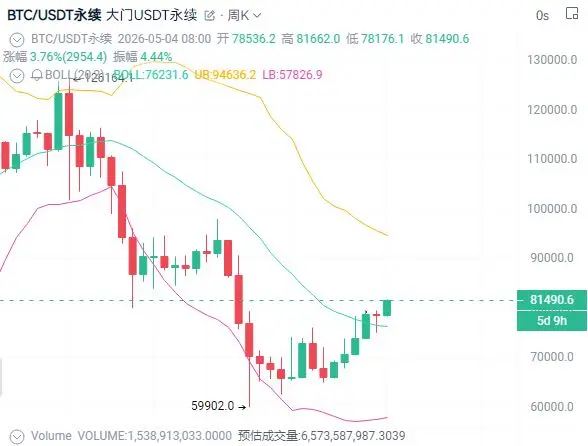
Bitcoin returns to $80,000, breaking through the middle band of the weekly Bollinger Bands, with momentum continuing to accumulate
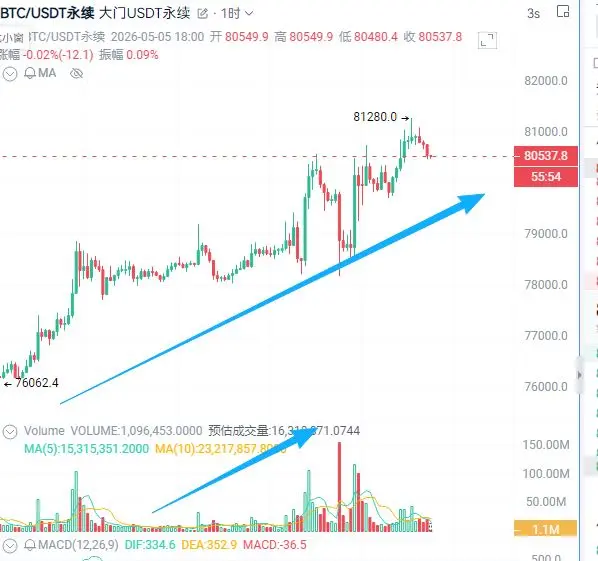
#美国寻求战略比特币储备 On Tuesday morning, multiple macroeconomic and market favorable factors jointly pushed Bitcoin back above the $80,000 mark, and technical indicators are also aligning positively, suggesting further upward potential.
On the weekly chart, the price has rebounded from the 20-week simple moving average (the middle band of the Bollinger Bands), confirming its dynamic support role. RSI remains neutral, stochastic indicator signals are rising into overbought territory, and the MACD histogram is deep in positive territory.
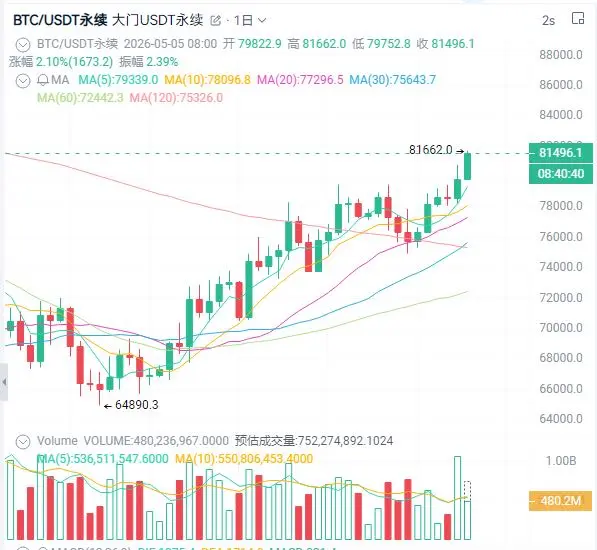
On the daily chart, the trend appears more optimistic. The price is steadily above the key moving average and hovers near the upper band of the Bollinger Bands. The stochastic indicator is in overbought territory with no signs of momentum fading, RSI is approaching the overbought threshold, and the rising ADX (Average Directional Index) indicates that bullish momentum may be strengthening rather than waning.
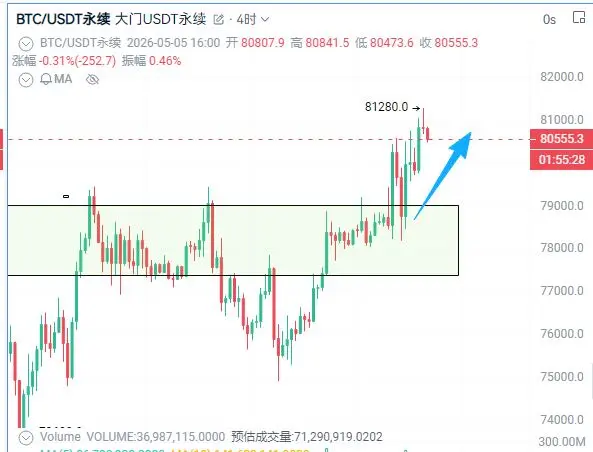
Key price levels to watch: support is around $78,500, with a broader demand zone below at $76,000–$77,000. The 20-period moving averages (SMA) on both weekly and daily charts also serve as dynamic support during any pullbacks. On the upside, $84,000 is the first resistance to break through, followed by the next significant levels at $87,000–$88,000.