SoominStar

vip
Age 1.5 Year
Peak Tier 5
No content yet
Pin
📢 Gate Square Summer Creation Camp is live — 50,000 USDT prize pool up for grabs.
Post original content with #SummerCreationCamp to join.
🎁 New creators: 50 USDT contract voucher for first post, 100 USDT voucher for consistent posting, plus 5 USDT daily lucky draws.
🏆 All creators: share 500 USDT prize pool for hitting milestones. Top content earns 20 USDT + featured placement + 7-day traffic boost.
📅 July 15 – July 27, 24:00 (UTC+8)
👉 https://www.gate.com/announcements/article/100685
#SummerCreationCamp
post-image
post-image
Gate_Square
📢 Gate Square Summer Creation Camp is live — 50,000 USDT prize pool up for grabs.
Post original content with #SummerCreationCamp to join.
🎁 New creators: 50 USDT contract voucher for first post, 100 USDT voucher for consistent posting, plus 5 USDT daily lucky draws.
🏆 All creators: share 500 USDT prize pool for hitting milestones. Top content earns 20 USDT + featured placement + 7-day traffic boost.
📅 July 15 – July 27, 24:00 (UTC+8)
👉 https://www.gate.com/announcements/article/100685
#SummerCreationCamp #GateSquare
repost-content-media
  • Reward
  • 20
  • 2
  • Share
Rashid_BNB:
Momentum is building. Stay sharp! 💪
View More
🇫🇷 France vs England — the World Cup third-place showdown!
Two strong teams that lost in the semifinals face their final match. Do you think France will claim the bronze medal, or will England make the last breakthrough?
⏰ Match time: 2026-07-19 05:00 (UTC+8)
Come to Gate Polymarket to predict the World Cup third-place match!
GateSquare
🇫🇷 France vs England — the World Cup third-place showdown!
Two strong teams that lost in the semifinals face their final match. Do you think France will claim the bronze medal, or will England make the last breakthrough?
⏰ Match time: 2026-07-19 05:00 (UTC+8)
Come to Gate Polymarket to predict the World Cup third-place match!
repost-content-media
  • Reward
  • 2
  • Repost
  • Share
Yusfirah:
DYOR 🤓
View More
#SummerCreationCamp
ICE Brent Crude Oil Speculators Net Longs at 169,839
The recent data showing ICE Brent crude oil speculators increasing their net long positions to 169,839 contracts represents a significant bullish sentiment shift in the energy markets. This positioning reflects growing confidence among managed money and institutional traders that crude oil prices are poised for further upside, driven primarily by escalating geopolitical tensions in the Middle East and tightening supply fundamentals.
Current Market Situation and Price Levels
As of mid-July 2026, Brent crude oil has exper
BZ4.07%
HighAmbition
#SummerCreationCamp
ICE Brent Crude Oil Speculators Net Longs at 169,839
The recent data showing ICE Brent crude oil speculators increasing their net long positions to 169,839 contracts represents a significant bullish sentiment shift in the energy markets. This positioning reflects growing confidence among managed money and institutional traders that crude oil prices are poised for further upside, driven primarily by escalating geopolitical tensions in the Middle East and tightening supply fundamentals.
Current Market Situation and Price Levels
As of mid-July 2026, Brent crude oil has experienced substantial volatility, with prices currently trading around $88 per barrel according to recent market data. This represents a significant recovery from earlier lows in the year when prices had dipped below $75. The current price action demonstrates that despite various attempts at diplomatic resolutions, the underlying supply risks remain elevated and market participants are pricing in sustained geopolitical premiums.
The technical picture shows Brent has established strong support around the $78.50 level, with immediate resistance sitting at $85.05. A decisive break above this resistance zone could open the path toward higher targets, potentially reaching the $90 to $95 range in the coming weeks. The market structure has shifted from contango to backwardation, which is typically indicative of tight near-term supplies and bullish sentiment among physical market participants.
The Iran Conflict Factor and Supply Risk Assessment
The ongoing conflict between the United States, Israel, and Iran represents the most significant geopolitical risk factor for oil markets in 2026. The Strait of Hormuz, through which approximately 20% of global oil supplies transit, remains a critical chokepoint that continues to drive risk premiums in crude oil pricing. Recent attacks on vessels and energy infrastructure in the region have reignited concerns about potential supply disruptions that could remove millions of barrels per day from global markets.
According to analytical assessments from major financial institutions, if Iranian oil exports were to cease completely due to the conflict, this would represent approximately a 4% reduction in global oil supply. Iran currently produces roughly 3.3 million barrels per day, making it the fifth-largest producer within OPEC+. The loss of these barrels would have immediate and severe implications for global oil balances, particularly given that global inventories have already been depleted significantly during earlier phases of the conflict.
Analysts at Oxford Economics have modeled various scenarios suggesting that if tit-for-tat attacks continue and Iranian exports cease, Brent crude could settle closer to $90 per barrel through 2026. In more extreme scenarios involving prolonged Strait of Hormuz disruptions, prices could spike significantly higher, with some analysts suggesting the potential for triple-digit oil if major supply routes face extended closures.
Price Forecast and Upside Potential
The current consensus among major brokerages suggests that oil prices have substantial room to run higher if geopolitical tensions persist. Morgan Stanley has raised its 2027 Brent oil price forecast to $80 per barrel, citing expectations for a lasting repricing of geopolitical risk after Strait of Hormuz disruptions left the market structurally tighter than previously assumed.
BloombergNEF estimates suggest that while their base case assumes Brent averaging $55 per barrel in 2026 under stable conditions, the current conflict has introduced a war premium of approximately $4 per barrel. Should the situation escalate further, additional conflict or trade policy disruptions could result in price upsides reminiscent of past war-related premiums seen during the Russia-Ukraine conflict.
From a technical perspective, if Brent successfully consolidates above the $85.05 resistance level, the next major target zone lies between $90 and $95. In the event of severe supply disruptions or escalation of the Iran conflict, prices could potentially test the $100 per barrel level, last seen during previous periods of major Middle East conflicts.
Trading Strategy and Risk Management
For traders looking to capitalize on the current crude oil environment, several strategic approaches warrant consideration. The elevated volatility requires disciplined risk management, with position sizing adjusted to account for potential daily price swings of 3% to 5%.
Trend-following strategies remain appropriate given the strong bullish momentum evidenced by the increasing net long positions among speculators. Traders should focus on establishing long positions on pullbacks to key support levels, particularly around the $78.50 to $80 zone, with stops placed below recent swing lows to protect against unexpected reversals.
Breakout trading strategies could prove effective if prices decisively breach the $85 resistance level. Such a breakout would likely trigger additional buying from momentum traders and could accelerate the move toward higher targets. Entry on confirmed breakouts with volume confirmation offers a lower-risk approach than chasing prices after extended moves.
For those concerned about the binary nature of geopolitical risk, options strategies such as long straddles or strangles could capture volatility expansion without requiring a directional bias. The elevated implied volatility in oil options currently makes premium selling strategies attractive for traders willing to accept the risks associated with short gamma positions.
Risk management remains paramount in this environment. Position sizes should be reduced compared to normal market conditions, with maximum risk per trade limited to 1% to 2% of account equity. The use of trailing stops can help protect profits while allowing winning positions to run as trends develop.
Fundamental Outlook and Key Catalysts
Looking ahead, several factors will determine the trajectory of crude oil prices. The resolution or escalation of the Iran conflict remains the primary variable, with any indication of a lasting peace agreement likely to trigger significant profit-taking and price declines. Conversely, additional military strikes or evidence of supply disruptions would likely drive prices higher.
OPEC+ production decisions will also play a crucial role in determining market balances. The organization has maintained relatively disciplined output levels, but any indication of increased production quotas could cap price gains. Additionally, Chinese demand recovery remains a key variable, with recent data suggesting some softness in the world's largest oil importer's appetite for crude.
The U.S. Strategic Petroleum Reserve, which has been depleted significantly during earlier phases of the conflict, now serves more as a backstop against sharp price declines rather than a tool for price suppression. This structural change in the reserve's role removes a potential source of downside price pressure.
The increase in ICE Brent crude oil speculator net longs to 169,839 reflects well-founded concerns about supply security in an increasingly volatile geopolitical environment. Current prices around $88 per barrel appear to have further upside potential if Middle East tensions persist, with technical targets in the $90 to $95 range and potential for $100+ in extreme scenarios. Traders should maintain a bullish bias while implementing strict risk management protocols to navigate the elevated volatility. The Iran conflict represents the primary catalyst for price movements, and close monitoring of developments in the Strait of Hormuz and broader Middle East region will be essential for successful positioning in the coming weeks and months.@Gate_Square #Crudeoil
repost-content-media
  • Reward
  • 4
  • Repost
  • Share
Yusfirah:
Ape In 🚀
View More
#广场预测世界杯赢40000U
The World Cup trophy is only one match away.
Spain and Argentina have reached the final through completely different journeys, and that's what makes this showdown so fascinating. One side believes in controlling every phase of the game. The other believes that patience, resilience, and perfect timing are enough to decide the biggest night in football.
This isn't simply a battle between two talented squads.
It's a clash of football philosophies.
Spain have been one of the tournament's most consistent teams. Their passing rhythm, intelligent movement, and ability to dominate p
post-image
post-image
2026 World Cup Winner
Spain
1.69x
59%
Argentina
2.47x
41%
$4.33M Vol+48 more
  • Reward
  • 5
  • Repost
  • Share
Yusfirah:
To The Moon 🌕
View More
#夏日创作营
#SummerCreationCamp
Bitcoin is no longer moving on excitement alone.
$BTC
It is moving on patience.
At the time of writing, BTC is trading around $64,000, holding above a key support zone but still struggling to establish itself above the next resistance. Price has recovered from recent weakness, yet every attempt to extend the rally is being met with fresh selling. The result is a market that looks calm on the surface but is quietly building pressure underneath.
This kind of structure deserves attention.
Strong trends often begin after periods of compression, not after explosiv
BTC1.77%
post-image
post-image
  • Reward
  • 4
  • Repost
  • Share
Yusfirah:
Buy To Earn 💰️
View More
$BTC
Bitcoin is holding its ground, but the market still hasn't made its final decision.
At the time of writing, BTC is trading around $63,960, hovering just below the key $64K resistance level. Over the past 24 hours, Bitcoin recovered from the lower end of its trading range and climbed back toward $64K. The rebound shows that buyers are still willing to defend important support levels. At the same time, every move toward higher prices continues to attract selling pressure, preventing a clean breakout.
This creates an interesting market structure.
Neither bulls nor bears are fully in contr
BTC1.77%
post-image
post-image
  • Reward
  • 3
  • Repost
  • Share
Yusfirah:
Diamond Hands 💎
View More
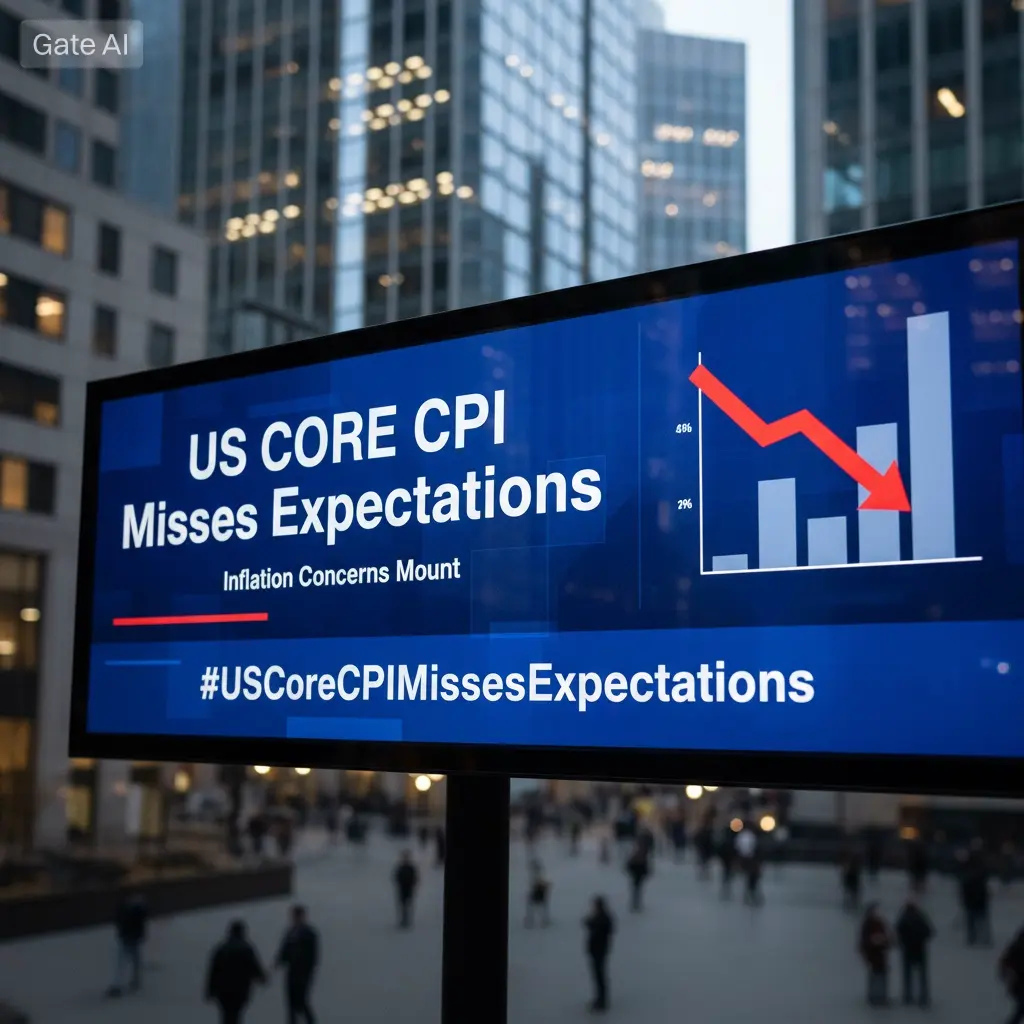
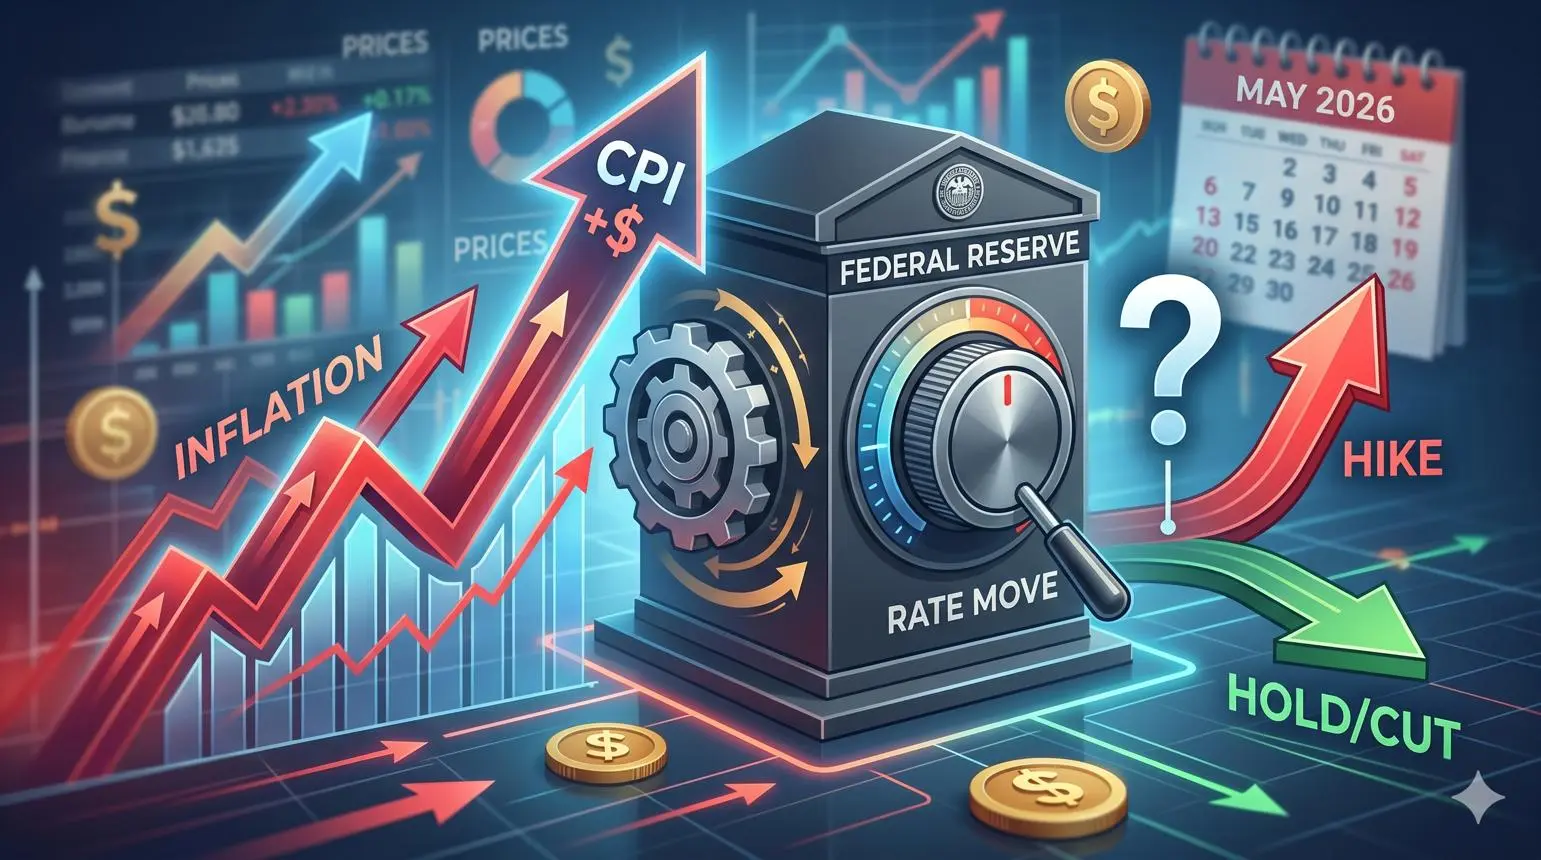
#USCoreCPIMissesExpectations
Inflation didn't disappear.
But the market's expectations changed overnight.
The latest U.S. Core CPI came in below forecasts, immediately shifting investor sentiment. Lower-than-expected inflation strengthened the belief that the Federal Reserve may be getting closer to ending its restrictive policy stance. Stocks reacted positively, Treasury yields eased, and crypto traders quickly began discussing the possibility of improved liquidity ahead.
However, one inflation report rarely tells the complete story.
Headline inflation slowed largely because energy prices m
BTC1.77%
ETH0.63%
post-image
  • Reward
  • 1
  • Repost
  • Share
HighAmbition:
Just go for it 👊
#USEndsLatestStrikesOnIran
#Geopolitics
Financial markets don't fear headlines.
They fear uncertainty.
The latest U.S. military operation targeting Iranian facilities has once again pushed geopolitical risk back into focus. The strikes reportedly targeted military infrastructure, including missile facilities, air-defense systems, command centers, and strategic locations linked to Iran's defense network. Within hours, concerns shifted from regional security to global financial markets.
The biggest question isn't whether military action occurred.
It's whether this conflict remains contained o
post-image
  • Reward
  • 3
  • Repost
  • Share
HighAmbition:
Just go for it 👊
View More
#USPPIComesInBelowExpectations
#SummerCreationCamp
U.S
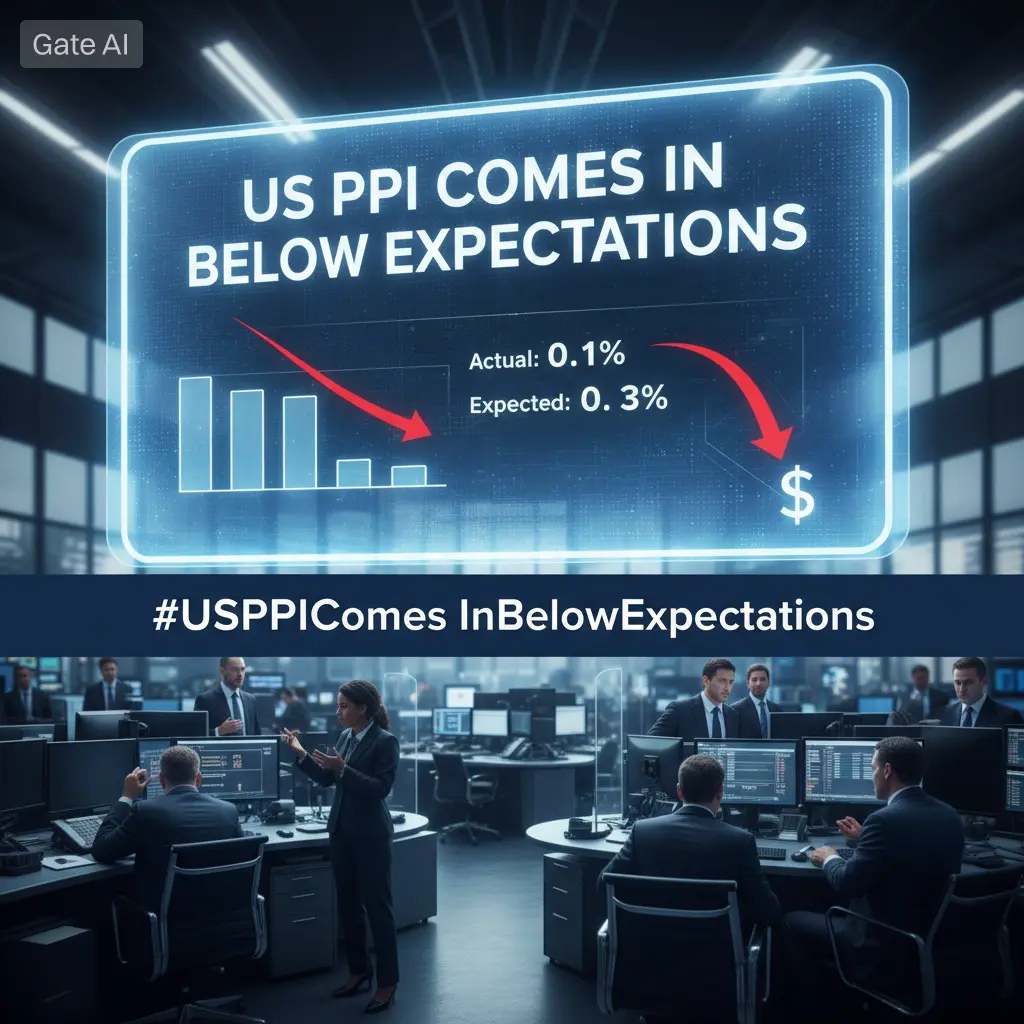
The market reacted quickly to the latest U.S. Producer Price Index report.
Lower inflation numbers immediately strengthened hopes that the Federal Reserve may be approaching the end of its tightening cycle. Stocks gained confidence, crypto sentiment improved, and many investors viewed the report as another green light for risk assets.
I think the bigger story goes beyond the headline.
June PPI increased less than economists expected, while monthly producer prices declined, mainly because of lower energy costs. Falling gasoline prices r
GAS-1.00%
BTC1.77%
ETH0.63%
post-image
  • Reward
  • 3
  • Repost
  • Share
HighAmbition:
Just go for it 👊
View More
#ETHStandsAbove1900
#SummerCreationCamp
Ethereum is once again testing investors' confidence.
Just a few days ago, ETH was racing toward the $1,950 mark. Today, the excitement has cooled, and many traders are wondering whether this pullback is the beginning of a deeper correction or simply a pause before the next move.
The market doesn't seem to be choosing a direction yet.
Instead, Ethereum is holding above one of its most important support areas while buyers and sellers continue fighting for control. This type of price action usually appears after a strong rally, when the market needs ti
ETH0.63%
post-image
  • Reward
  • 3
  • Repost
  • Share
HighAmbition:
Just go for it 👊
View More
#ETHStandsAbove1900
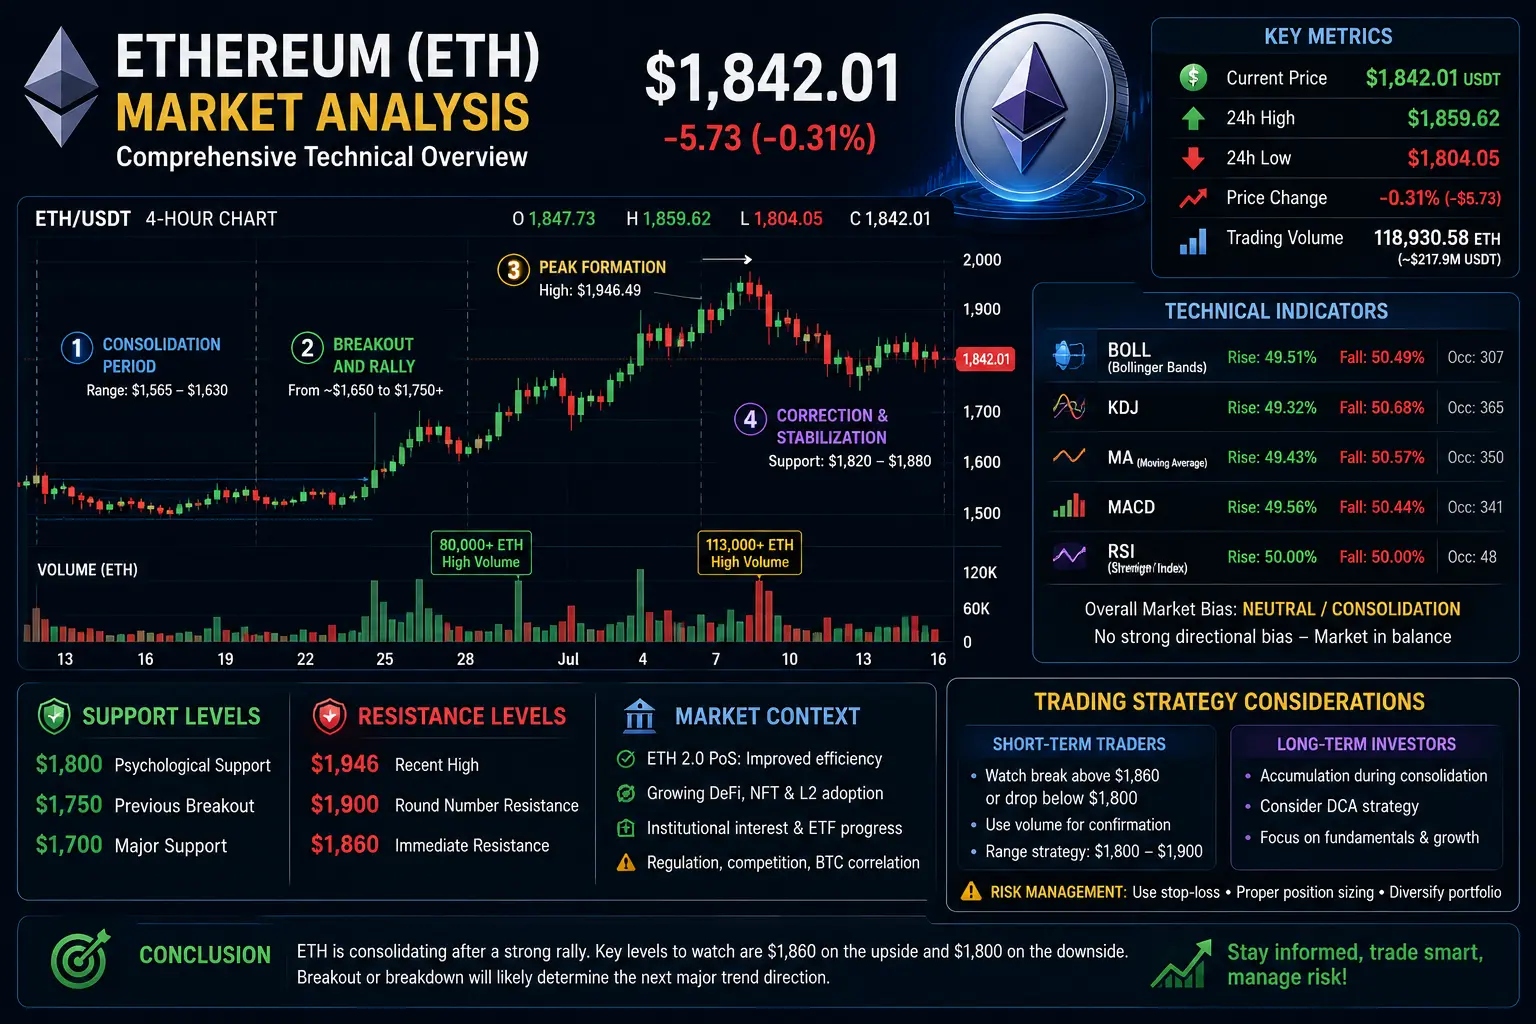
Ethereum (ETH) is currently trading at $1,842.01, showing a slight decline of -0.31% (-$5.73) from the opening price of $1,847.73. The cryptocurrency has experienced significant volatility over the past several days, with prices ranging from a low of $1,565.30 to a high of $1,946.49, representing a dynamic trading environment that offers both opportunities and risks for investors.
Current Market Status
Key Metrics:
Current Price: $1,842.01 USDT
24h High: $1,859.62
24h Low: $1,804.05
Price Change: -0.31% (-$5.73)
Trading Volume: 118,930.58 ETH (~$217.9M USDT)
The current tr
ETH0.63%
BTC1.77%
HighAmbition
#ETHStandsAbove1900
Ethereum (ETH) is currently trading at $1,842.01, showing a slight decline of -0.31% (-$5.73) from the opening price of $1,847.73. The cryptocurrency has experienced significant volatility over the past several days, with prices ranging from a low of $1,565.30 to a high of $1,946.49, representing a dynamic trading environment that offers both opportunities and risks for investors.
Current Market Status
Key Metrics:
Current Price: $1,842.01 USDT
24h High: $1,859.62
24h Low: $1,804.05
Price Change: -0.31% (-$5.73)
Trading Volume: 118,930.58 ETH (~$217.9M USDT)
The current trading session shows ETH maintaining relative stability around the $1,840-$1,850 range, with the market demonstrating resilience despite minor downward pressure.
Technical Analysis
Price Action Overview
The 4-hour candlestick chart reveals several critical phases in ETH's recent price movement:
Phase 1: Consolidation Period (Early Period)
During the initial phase of the observed timeframe, ETH traded in a relatively tight range between $1,565 and $1,630. This period was characterized by low volatility and accumulation, setting the foundation for subsequent price movements.
Phase 2: Breakout and Rally
A significant breakout occurred when ETH surged from approximately $1,650 to reach highs near $1,750. This upward momentum was accompanied by increased trading volume, indicating strong buying pressure and market confidence. The rally continued with ETH establishing higher lows and testing resistance levels around $1,800.
Phase 3: Peak Formation
ETH reached its recent peak at $1,946.49, representing a substantial gain from the consolidation lows. This peak formation was accompanied by heavy trading volume of over 63,473 ETH in a single 4-hour period, suggesting intense market activity and potential distribution at these elevated levels.
Phase 4: Correction and Stabilization
Following the peak, ETH experienced a natural correction, retracing to levels between $1,820 and $1,880. This corrective phase appears to be finding support, with the current price action suggesting a potential base formation around the $1,840 level.
Volume Analysis
Trading volume patterns provide valuable insights into market sentiment:
Average Volume: The typical 4-hour volume ranges between 15,000-30,000 ETH
High Volume Events: Significant spikes occurred during breakout moves, with volumes exceeding 80,000-113,000 ETH during major price movements
Current Volume: The recent volume of 4,192 ETH suggests a period of consolidation and reduced volatility
The volume profile indicates that major price movements are supported by substantial trading activity, lending credibility to trend directions.
Technical Indicators
The market data includes several key technical indicators that provide probabilistic insights:
Bollinger Bands (BOLL):
Rise Probability: 49.51%
Fall Probability: 50.49%
Historical Occurrences: 307
KDJ Indicator:
Rise Probability: 49.32%
Fall Probability: 50.68%
Historical Occurrences: 365
Moving Average (MA):
Rise Probability: 49.43%
Fall Probability: 50.57%
Historical Occurrences: 350
MACD:
Rise Probability: 49.56%
Fall Probability: 50.44%
Historical Occurrences: 341
RSI:
Rise Probability: 50.00%
Fall Probability: 50.00%
Historical Occurrences: 48
The indicators collectively suggest a balanced market with no strong directional bias, indicating that ETH is currently in a consolidation phase where neither bulls nor bears have definitive control.
Support and Resistance Levels
Key Resistance Levels:
1. $1,946 - Recent high and psychological resistance
2. $1,900 - Round number resistance
3. $1,860 - Immediate resistance (24h high)
Key Support Levels:
1. $1,800 - Psychological support and recent consolidation area
2. $1,750 - Previous breakout level
3. $1,700 - Major support from earlier rally
Market Context and Fundamentals
Ethereum continues to maintain its position as the second-largest cryptocurrency by market capitalization. Several fundamental factors influence its current price action:
Positive Factors:
Ethereum's transition to Proof-of-Stake has improved energy efficiency and network sustainability
Growing DeFi ecosystem and NFT marketplace activity
Institutional adoption and Ethereum-based ETF developments
Layer 2 scaling solutions reducing transaction costs
Considerations:
Network congestion during high activity periods
Competition from alternative smart contract platforms
Regulatory developments affecting the broader crypto market
Correlation with Bitcoin price movements
Trading Strategy Considerations
For traders and investors considering ETH positions:
Short-term Traders:
Watch for breakout above $1,860 or breakdown below $1,800 for directional signals
Monitor volume spikes for confirmation of trend strength
Consider range-bound strategies between $1,800-$1,900 support/resistance
Long-term Investors:
Current levels may present accumulation opportunities during consolidation
Dollar-cost averaging strategy could be effective in this volatile environment
Monitor macroeconomic factors and crypto regulatory developments
Risk Management:
Set appropriate stop-loss levels based on support/resistance
Position sizing should account for ETH's inherent volatility
Consider portfolio diversification across different asset classes
Conclusion
Ethereum is currently navigating a consolidation phase following a significant rally. The price action around $1,840 suggests market indecision, with traders awaiting clearer directional signals. The balanced technical indicators and moderate volume point to a period of equilibrium before the next significant move.
Traders should remain vigilant for breakout signals above $1,860 or breakdown below $1,800, as these levels are likely to determine the next major trend direction. The overall structure remains constructive for ETH, with the cryptocurrency maintaining its position above key support levels while digesting recent gains.
As always, cryptocurrency markets carry inherent risks, and participants should conduct thorough research and consider their risk tolerance before making investment decisions.
#SummerCreationCamp @Gate_Square
repost-content-media
  • Reward
  • 3
  • Repost
  • Share
HighAmbition:
Just go for it 👊
View More
#WarshSaysFedDecidesIfAIInflation
Artificial intelligence is attracting record levels of investment, and with that comes an important debate. As spending on data centers, advanced chips, and cloud infrastructure continues to rise, many investors assume inflation will inevitably follow. It sounds logical, but the relationship isn't quite that simple.
Kevin Warsh recently offered a different perspective. In his view, AI is not automatically inflationary. It can create temporary price pressure in sectors experiencing rapid demand, but lasting inflation depends far more on how the Federal Reserv
ON-0.81%
CLOUD-3.71%
post-image
  • Reward
  • 1
  • Repost
  • Share
HighAmbition:
Just go for it 👊
Every market cycle tells a different story.
Some are driven by excitement. Others are shaped by fear. Right now, many investors believe crypto is losing momentum. I see it differently.
$BTC
Bitcoin has fallen sharply from its previous highs, but this correction doesn't resemble the deep bear markets we've experienced in the past. Instead of widespread panic, the market is showing signs of consolidation while institutional participation and long-term adoption continue to grow.
One indicator deserves special attention: the Investor Price, currently estimated around $48K. Historically, this le
BTC1.77%
ETH0.63%
post-image
post-image
  • Reward
  • 1
  • Repost
  • Share
HighAmbition:
Just go for it 👊
#USDTDepositEarningsDoublePlay
$USDT
Every trader knows one feeling.
USDT is sitting in the account.
Waiting.
Not earning.
What if those idle funds could generate value while staying ready for your next trade?
That's the idea behind Gate's USDT Deposit Earnings Double Play.
It's not simply a savings product.
It's a strategy that combines passive income with additional platform rewards, allowing one deposit to work in more than one way.
The first advantage is straightforward.
Deposit USDT and start earning competitive annualized returns. Instead of letting stablecoins remain inactive, they
post-image
  • Reward
  • 1
  • Repost
  • Share
HighAmbition:
Just go for it 👊
#TSMCQ2NetProfitSurges77%
@Gate_Square #SummerCreationCamp

AI is changing the world.
But AI can't grow without powerful chips.
That's where TSMC comes in.
Its latest earnings weren't just strong. They were exceptional.
Net profit jumped 77.4% year over year, reaching a record level. Revenue also climbed to an all-time high, beating market expectations and proving that AI demand is still accelerating.
This wasn't luck.
It was the result of one powerful trend.
The world's biggest technology companies continue to depend on TSMC to manufacture their most advanc
TSM-2.97%
post-image
  • Reward
  • 2
  • Repost
  • Share
HighAmbition:
Just go for it 👊
View More
#TSMCQ2NetProfitSurges77%
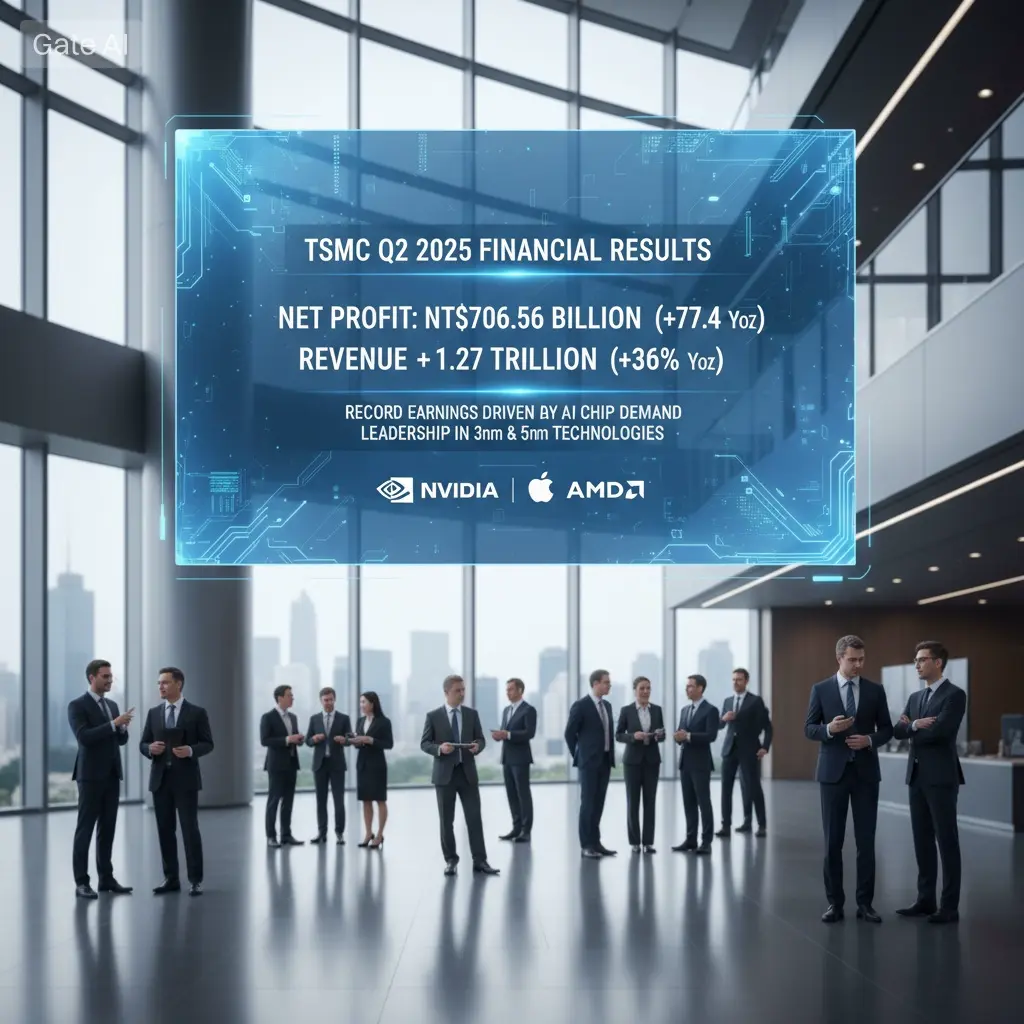
Taiwan Semiconductor Manufacturing Company Limited, commonly known as TSMC, has delivered an exceptional financial performance in the second quarter of 2025, marking a historic milestone in the semiconductor industry. The world's largest contract chip manufacturer reported a staggering 77.4 percent year-over-year increase in net profit, reaching an unprecedented NT$706.56 billion which translates to approximately $21.99 billion in United States dollars. This remarkable achievement represents the ninth consecutive quarter of double-digit percentage growth for the comp
HighAmbition
#TSMCQ2NetProfitSurges77%
Taiwan Semiconductor Manufacturing Company Limited, commonly known as TSMC, has delivered an exceptional financial performance in the second quarter of 2025, marking a historic milestone in the semiconductor industry. The world's largest contract chip manufacturer reported a staggering 77.4 percent year-over-year increase in net profit, reaching an unprecedented NT$706.56 billion which translates to approximately $21.99 billion in United States dollars. This remarkable achievement represents the ninth consecutive quarter of double-digit percentage growth for the company, demonstrating sustained momentum in an increasingly competitive global market.
Revenue figures paint an equally impressive picture of TSMC's dominance in the semiconductor sector. Consolidated revenue for the April to June period reached NT$1,270.38 billion, equivalent to roughly $39.6 billion, reflecting a robust 36 percent increase compared to the same period in the previous year. When measured in United States dollars, second quarter revenue stood at $40.2 billion, representing a substantial 33.7 percent year-over-year growth. This performance significantly exceeded market expectations, as analysts had projected net profit of approximately NT$632.6 billion based on LSEG SmartEstimate data, meaning TSMC beat estimates by approximately 11.7 percent.
The earnings per share metric further underscores the magnitude of this achievement. TSMC reported diluted earnings per share of NT$27.25, establishing a new all-time high for the company. This figure surpassed previous records and demonstrated the company's ability to generate substantial returns for shareholders while simultaneously investing heavily in cutting-edge manufacturing capabilities. Compared to the previous quarter's EPS of approximately NT$22.10, this represents a sequential increase of roughly 23.3 percent.
The primary driver behind this extraordinary financial performance is the unprecedented global demand for artificial intelligence infrastructure and advanced semiconductor technologies. TSMC has positioned itself as the indispensable supplier for AI chip manufacturers, with major customers including Nvidia, Apple, AMD, Qualcomm, and numerous other technology giants relying on TSMC's manufacturing expertise. The company's advanced process nodes have become critical components in the global AI revolution, with demand showing no signs of slowing as enterprises worldwide accelerate their AI adoption strategies.
Breaking down revenue by technology node reveals the strategic importance of TSMC's most advanced manufacturing processes. Advanced process nodes measuring 7 nanometers and below collectively accounted for 77 percent of total wafer revenue during the second quarter, demonstrating the company's successful transition toward higher-margin leading-edge technologies. The 3 nanometer process technology contributed 30 percent of revenue, while the 5 nanometer process accounted for 33 percent. Notably, the company's latest 2 nanometer process technology has begun generating revenue, currently representing 3 percent of total sales but positioned for significant expansion as production ramps up throughout 2025 and 2026.
The gross profit margin for the second quarter reached an impressive 58.6 percent, while operating margin stood at 49.6 percent. The net profit margin of 42.7 percent reflects the company's exceptional operational efficiency and pricing power in an environment of sustained high demand. These margin metrics demonstrate TSMC's ability to maintain profitability while making substantial investments in research and development and manufacturing capacity expansion. Compared to industry averages of approximately 45-50 percent gross margin for leading semiconductor manufacturers, TSMC's performance stands out as exceptional.
Looking at sequential performance, TSMC's second quarter net income of NT$706.56 billion represented a 23.4 percent increase compared to the first quarter's profit of NT$572.48 billion. June revenue alone reached NT$442.68 billion, establishing a record for the month with a remarkable 67.9 percent year-over-year increase. This acceleration in growth momentum suggests that demand continues to strengthen rather than plateau, with monthly trends indicating potential for even stronger performance in subsequent quarters.
The company's capital expenditure plans reflect management's confidence in the durability of current demand trends. TSMC has indicated that 2026 capital expenditure will be at the high end of earlier guidance ranging from $52 billion to $56 billion, representing a 7.7 percent to 15.4 percent increase from 2025 levels. Additionally, the company announced plans to invest an additional $100 billion in its Arizona foundry operations over the coming years to meet soaring global demand for advanced semiconductors. This massive investment commitment signals TSMC's expectation that the current AI-driven demand cycle will persist for years to come, with the company preparing for sustained capacity constraints in advanced nodes.
Analysts broadly anticipate that TSMC will raise its full-year revenue growth outlook based on these results. Current consensus estimates suggest full-year 2025 revenue growth of approximately 25-30 percent, though some optimistic projections now see potential for 35 percent or higher growth. The company's sustained demand visibility and improved long-term revenue projections suggest the possibility of increasing the 2026 revenue growth target and long-term compound annual growth rate expectations from the current 15-20 percent range toward 20-25 percent.
The strong demand for 3 nanometer and 2 nanometer process technologies specifically designed for AI applications, combined with advanced chip packaging technology known as CoWoS (Chip-on-Wafer-on-Substrate), remains robust according to industry analysts. CoWoS capacity has been a particular bottleneck, with TSMC reportedly running at over 95 percent utilization rates for advanced packaging. The company has announced plans to expand CoWoS capacity by more than 50 percent in 2025 to address this constraint.
From a competitive positioning perspective, TSMC's results widen the gap between the company and its closest rivals. Samsung Foundry, the second-largest contract manufacturer, has struggled to match TSMC's yields and performance in advanced nodes, while Intel's foundry business remains in early stages of development. TSMC's market share in advanced nodes (7nm and below) now exceeds 85 percent, giving the company near-monopoly status in the most critical semiconductor technologies for AI applications.
The financial markets have responded to these results with mixed sentiment. While TSMC's operational performance exceeded all expectations, the company's New York-listed shares experienced a decline of over 4 percent in premarket trading following the announcement. This price movement reflects broader semiconductor sector volatility, with stocks of Intel, AMD, Micron, and Sandisk also declining in premarket sessions. Some analysts attribute the sell-off to profit-taking after a strong run-up in TSMC shares, which had gained approximately 65 percent year-to-date prior to the earnings announcement. Others point to concerns about potential export restrictions or geopolitical risks affecting Taiwan-based manufacturing.
From a strategic perspective, TSMC's results validate its decision to aggressively pursue leadership in advanced process technologies. The company has successfully positioned itself at the center of the artificial intelligence revolution, manufacturing the chips that power everything from data centers to consumer devices. As AI adoption accelerates across industries, TSMC's technological moat appears to be widening rather than narrowing. The company's research and development spending of approximately $5 billion in the first half of 2025, representing roughly 8 percent of revenue, ensures continued technology leadership.
The implications of TSMC's performance extend beyond the company itself to the broader technology ecosystem. Strong results from the world's leading semiconductor manufacturer suggest continued robust demand for AI infrastructure, supporting optimistic projections for the technology sector. Companies throughout the semiconductor supply chain, from equipment manufacturers like ASML and Applied Materials to materials suppliers and testing services, stand to benefit from TSMC's continued expansion. ASML, the exclusive supplier of EUV lithography equipment, has seen its order backlog expand significantly as TSMC and other manufacturers compete for limited equipment availability.
Looking ahead, TSMC has provided guidance for the third quarter of 2025 that suggests continued strong performance. The company expects revenue between $31.8 billion and $33.0 billion, representing sequential growth of approximately 5.5 to 9.5 percent. Gross margin guidance of 55.5 percent to 57.5 percent and operating margin guidance of 45.5 percent to 47.5 percent suggest margin sustainability despite ongoing investments in capacity expansion. These projections would put TSMC on track for full-year revenue exceeding $125 billion, a 28 percent increase from 2024's $97.7 billion.
The geographic diversification strategy remains a key focus for TSMC management. Beyond the $100 billion Arizona investment, the company is expanding facilities in Japan and evaluating options in Europe. These investments aim to address geopolitical concerns about concentration of advanced semiconductor manufacturing in Taiwan, while also positioning TSMC closer to major customers in North America and other regions. However, Taiwan will remain the center of TSMC's operations, with approximately 90 percent of advanced node capacity expected to remain on the island through 2030.
In terms of valuation metrics, TSMC's strong earnings performance has improved key ratios despite the recent share price appreciation. The price-to-earnings ratio based on trailing twelve months earnings now stands at approximately 22x, compared to 35x for Nvidia and 28x for the broader semiconductor sector. This suggests TSMC may offer relative value despite its dominant market position and strong growth trajectory. The company's return on equity of approximately 32 percent and return on invested capital of roughly 25 percent rank among the highest in the technology sector.
The sustainability of TSMC's growth trajectory depends on several factors. Continued AI investment by major technology companies provides near-term demand visibility, with hyperscalers like Microsoft, Amazon, Google, and Meta collectively planning over $200 billion in capital expenditure for 2025, much of which flows to semiconductor purchases. Longer-term, the expansion of AI to edge devices, autonomous vehicles, and industrial applications should provide additional growth vectors beyond data center infrastructure.
@Gate_Square #SummerCreationCamp

repost-content-media
  • Reward
  • 2
  • Repost
  • Share
HighAmbition:
To The Moon 🌕
View More
When Headlines Turn Negative, Smart Traders Watch Liquidity 👀
Crypto cooled off as regulatory uncertainty in the U.S. collided with a global tech selloff sparked by China's latest AI breakthrough. Instead of panic, the market is shifting into a wait-and-see phase.
📊 Current Market • $BTC around $63.3K • $ETH near $1.83K • $XRP around $1.08 • Total crypto market cap moved lower as risk appetite weakened.
🏛️ Regulatory Watch The CLARITY Act remains one of the biggest catalysts for the industry. While discussions continue, the lack of immediate progress has left investors waiting for stronger
BTC1.77%
ETH0.63%
XRP0.23%
Rashid_BNB
When Headlines Turn Negative, Smart Traders Watch Liquidity 👀
Crypto cooled off as regulatory uncertainty in the U.S. collided with a global tech selloff sparked by China's latest AI breakthrough. Instead of panic, the market is shifting into a wait-and-see phase.
📊 Current Market • $BTC around $63.3K • $ETH near $1.83K • $XRP around $1.08 • Total crypto market cap moved lower as risk appetite weakened.
🏛️ Regulatory Watch The CLARITY Act remains one of the biggest catalysts for the industry. While discussions continue, the lack of immediate progress has left investors waiting for stronger policy signals.
🌐 Global Macro Impact Moonshot AI's Kimi K3 launch sparked heavy selling across AI and semiconductor stocks, dragging broader financial markets lower. As crypto remains tied to global sentiment, digital assets followed the risk-off move.
🔍 Market Outlook Short-term volatility may continue, but the next major move could depend on two factors: • Progress on U.S. crypto regulation. • Whether global equity markets regain stability.
Markets often test conviction before revealing direction. Stay disciplined, protect your capital, and let confirmation lead your decisions.
This is personal market analysis, not financial advice. Always DYOR.
$BTC ‌$ETH ‌$XRP ‌#PreIPOsSeason2OpenAISubscription #GateDEXIntegratesWithRobinhoodChain #TSMCQ2NetProfitSurges77%
  • Reward
  • Comment
  • Repost
  • Share
#GateDEXIntegratesWithRobinhoodChain
Every major crypto cycle is defined by one breakthrough. This time, it isn't a new token or another Layer-1 blockchain it's connectivity.
Gate DEX's integration with Robinhood Chain signals a shift toward an ecosystem where digital assets move more freely and blockchain networks work together instead of operating in isolation.
For years, decentralized finance has promised an open financial system, but fragmented liquidity and disconnected ecosystems have limited its full potential. Integrations like this help solve that challenge by creating smoother path
HOOD-5.50%
post-image
  • Reward
  • 1
  • Repost
  • Share
HighAmbition:
Just go for it 👊
#GateDEXIntegratesWithRobinhoodChain
Gate DEX Meets Robinhood Chain: Why This Integration Is Bigger Than Just Another Network Addition
Most blockchain integrations add another chain to a wallet. This one aims to expand what users can actually do across ecosystems.
Gate has officially integrated Robinhood Chain into its Web3 ecosystem, allowing users to access ecosystem assets, manage wallets, execute on-chain transactions, and perform cross-chain swaps from a single interface. While it may look like a routine product update, the broader significance lies in how multi-chain infrastructure is e
ETH0.63%
BNB-0.14%
ZRO0.47%
FUN-5.46%
DragonFlyOfficial
#GateDEXIntegratesWithRobinhoodChain
Gate DEX Meets Robinhood Chain: Why This Integration Is Bigger Than Just Another Network Addition
Most blockchain integrations add another chain to a wallet. This one aims to expand what users can actually do across ecosystems.
Gate has officially integrated Robinhood Chain into its Web3 ecosystem, allowing users to access ecosystem assets, manage wallets, execute on-chain transactions, and perform cross-chain swaps from a single interface. While it may look like a routine product update, the broader significance lies in how multi-chain infrastructure is evolving.
Today's Web3 users no longer stay on a single blockchain. Liquidity moves between Ethereum, BNB Chain, Base, emerging Layer 2s, and application-specific chains. Every additional bridge or wallet switch introduces friction, delays, and security considerations. Platforms that reduce these barriers are positioning themselves for the next phase of on-chain adoption.
With this integration, Gate DEX now supports Robinhood Chain alongside Ethereum, BNB Chain, and Base, while enabling cross-chain interoperability through Across and LayerZero. Users can also interact with ecosystem platforms such as Noxa fun and Bankr, creating a broader gateway into decentralized applications without constantly leaving the Gate Web3 environment.
From a market perspective, this move reflects one of the strongest trends in blockchain development: interoperability. Instead of competing to become the only blockchain users need, projects are increasingly competing to become the easiest ecosystem to connect with. Liquidity, user experience, and cross-chain accessibility are becoming more important than simply adding another supported network.
The bullish case is clear. If Robinhood Chain attracts developers, users, and on-chain liquidity, early infrastructure partners could benefit from increased transaction activity and stronger ecosystem engagement. Integrated trading, wallet management, and seamless asset movement create a more efficient experience for both newcomers and experienced Web3 users.
However, investors and users should also consider the risks. Cross-chain infrastructure remains one of the most targeted areas for security exploits across the blockchain industry. Although interoperability protocols continue to improve, bridges and messaging layers have historically been attractive targets for attackers. Adoption will ultimately depend not only on technology but also on security, liquidity depth, and sustained developer activity.
This announcement also highlights an important competitive shift. Exchanges are no longer competing only on spot trading volumes. They are evolving into complete Web3 ecosystems that combine wallets, decentralized trading, cross-chain infrastructure, and ecosystem discovery in a single platform. The projects that simplify this experience are likely to have an advantage as blockchain adoption continues to expand.
For active traders, this integration could translate into faster access to emerging ecosystem opportunities before they become widely recognized. For long-term participants, it signals that multi-chain connectivity is becoming a core requirement rather than an optional feature.
The next stage of Web3 growth may not be determined by which blockchain wins—but by which ecosystem makes moving across blockchains feel effortless.
Dragon Fly Official
Question: Do you think the future belongs to one dominant blockchain, or to ecosystems that seamlessly connect multiple chains?
repost-content-media
  • Reward
  • Comment
  • Repost
  • Share
#PreIPOsSeason2OpenAISubscription
#PreIPOs第二期OpenAI认购
Every market cycle has one defining theme.
The internet reshaped communication. Smartphones transformed daily life. Blockchain redefined finance. Today, Artificial Intelligence is driving the next technological revolution, and the companies leading this movement are creating value long before they ever reach public markets.
That's exactly why I decided to participate in Gate Pre-IPO Phase 2: OpenAI (OPENAI).
I wasn't chasing headlines I was positioning myself for a long-term opportunity.
OpenAI has become one of the most recognized nam
GUSD0.01%
GT1.21%
SPCX-0.02%
post-image
post-image
  • Reward
  • 1
  • Repost
  • Share
HighAmbition:
Just go for it 👊
#USCoreCPIMissesExpectations
U.S. Core CPI Misses Expectations: Is the Federal Reserve Finally Winning the Inflation Battle?
Inflation has been the single biggest driver of global financial markets over the past few years. Every CPI report influences expectations for interest rates, stocks, bonds, and cryptocurrencies.
The latest U.S. Consumer Price Index (CPI) delivered another encouraging surprise. Core CPI increased 2.7% year over year in June, slightly below the 2.8% consensus estimate and lower than the 2.9% recorded in May. At the same time, headline CPI fell 0.1% month over month, mark
BTC1.77%
ETH0.63%
DragonFlyOfficial
#USCoreCPIMissesExpectations
U.S. Core CPI Misses Expectations: Is the Federal Reserve Finally Winning the Inflation Battle?
Inflation has been the single biggest driver of global financial markets over the past few years. Every CPI report influences expectations for interest rates, stocks, bonds, and cryptocurrencies.
The latest U.S. Consumer Price Index (CPI) delivered another encouraging surprise. Core CPI increased 2.7% year over year in June, slightly below the 2.8% consensus estimate and lower than the 2.9% recorded in May. At the same time, headline CPI fell 0.1% month over month, marking the first monthly decline since 2020, while the annual headline inflation rate slowed from 4.2% to 3.8%.
The data suggests that inflation continues moving in the right direction—but the story is more complicated than the headline numbers imply.
What Is Core CPI?
The Consumer Price Index measures changes in the prices consumers pay for goods and services.
Core CPI excludes food and energy because those categories tend to experience sharp short-term price swings.
Federal Reserve officials closely monitor Core CPI because it provides a clearer picture of underlying inflation trends and is considered a better guide for long-term monetary policy decisions.
Why Did Inflation Slow?
The largest contribution came from lower energy prices.
Falling fuel costs helped push the monthly headline CPI into negative territory for the first time in several years.
Lower energy prices reduce transportation and production costs across the economy, helping ease inflationary pressure for both businesses and consumers.
This follows recent Producer Price Index (PPI) data, which also showed declining producer inflation, strengthening confidence that overall price pressures are gradually easing.
The Problem: Services Inflation Remains Sticky
Although headline inflation improved, one important challenge remains.
Core services inflation continues to stay elevated.
Higher costs for:
Housing
Auto insurance
Other service-related expenses
are keeping underlying inflation well above the Federal Reserve's long-term 2% target.
Unlike energy prices, service inflation usually declines more slowly because it is closely linked to wages, labor markets, and consumer demand.
This means the Fed is unlikely to declare victory based on one encouraging report.
How Markets Reacted
Financial markets responded quickly to the data.
Several important changes occurred:
Expectations for a July Federal Reserve rate hike declined from roughly 50% to well below previous levels.
U.S. Treasury yields moved lower as investors priced in a less aggressive monetary policy outlook.
Stocks and cryptocurrencies generally welcomed the softer inflation reading because lower interest-rate expectations improve liquidity and support risk assets.
The report strengthened optimism that inflation is gradually coming under control, although uncertainty remains.
What Does This Mean for the Federal Reserve?
The Fed now faces a more balanced situation.
On one hand:
Inflation continues slowing.
Energy prices are helping reduce headline inflation.
Financial markets expect less aggressive tightening.
On the other hand:
Core services inflation remains stubborn.
Housing costs continue rising.
Inflation is still above the Fed's official target.
As a result, policymakers may prefer waiting for several months of consistent improvement before considering meaningful policy easing.
Market Impact
Stocks
Technology and growth stocks generally benefit when inflation slows because lower interest-rate expectations improve company valuations.
Bonds
Cooling inflation usually supports bond prices by reducing pressure for higher yields.
Cryptocurrency
Bitcoin and Ethereum often react positively when investors expect lower interest rates and improved market liquidity.
However, crypto markets remain sensitive to future Federal Reserve communication.
Bullish Perspective
Several positive developments are becoming increasingly clear:
Inflation is slowing steadily.
Core CPI came in below expectations.
Headline CPI recorded its first monthly decline since 2020.
Rate-hike expectations continue falling.
Financial conditions may become more supportive for risk assets.
If future inflation reports confirm this trend, markets could become increasingly optimistic about eventual monetary policy easing.
Bearish Risks
Investors should also remain cautious.
Core services inflation remains persistent.
Housing inflation has not yet normalized.
Energy prices could rebound.
Geopolitical events may increase commodity prices again.
The Federal Reserve could maintain restrictive policy longer than markets currently expect.
A few favorable inflation reports do not guarantee that inflation has been permanently defeated.
Final Thoughts
June's CPI report represents another meaningful step in the fight against inflation.
The combination of lower headline inflation, softer Core CPI, and declining energy prices provides encouraging evidence that previous monetary tightening is having its intended effect.
However, persistent services inflation reminds investors that the Federal Reserve's work is not yet complete.
The coming months will likely determine whether the U.S. economy achieves a soft landing—or whether inflation proves more stubborn than markets currently expect.
Dragon Fly Official
Do you believe the Federal Reserve is getting close to cutting interest rates, or will sticky services inflation keep policy tight for longer?
repost-content-media
  • Reward
  • 8
  • Repost
  • Share
MrFlower_XingChen:
To The Moon 🌕
View More
  • Pinned