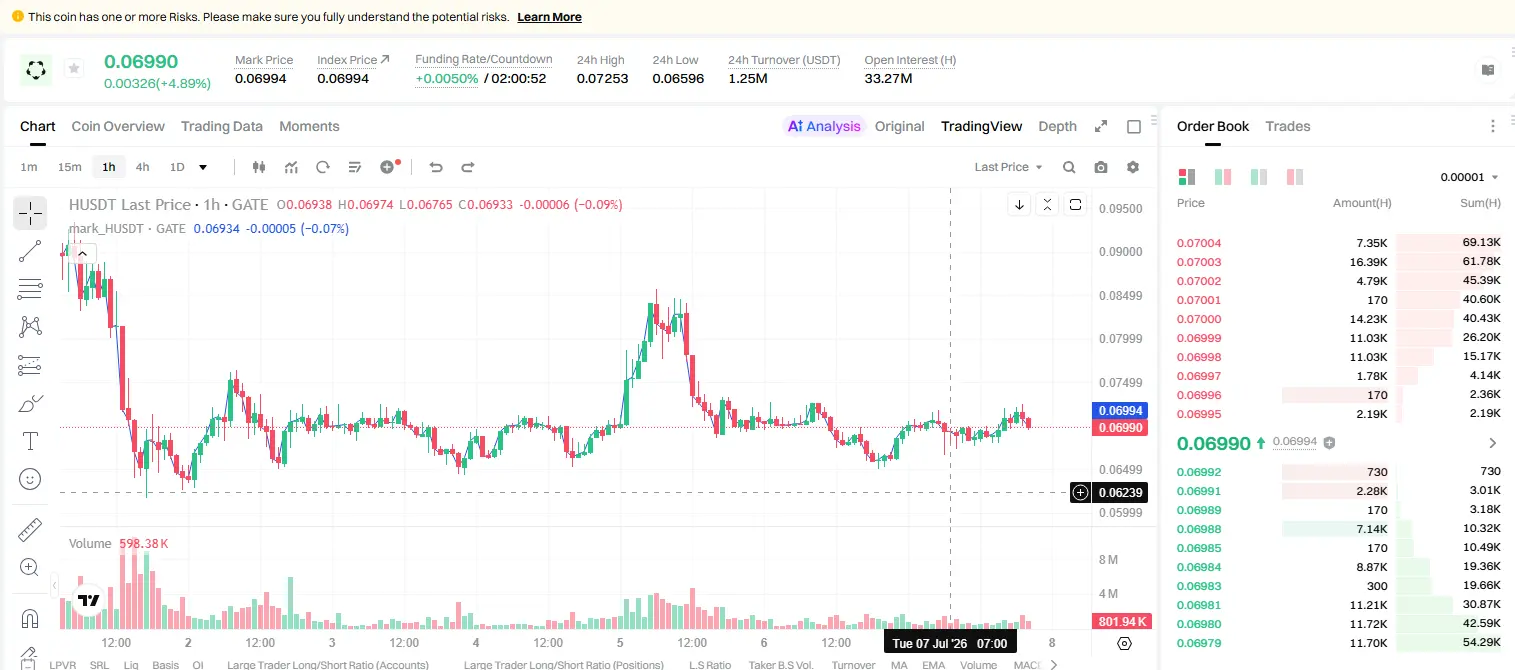
$H /USDT 4-hour bearish signal armed, will it break the range this time?
$H /USDT - Short
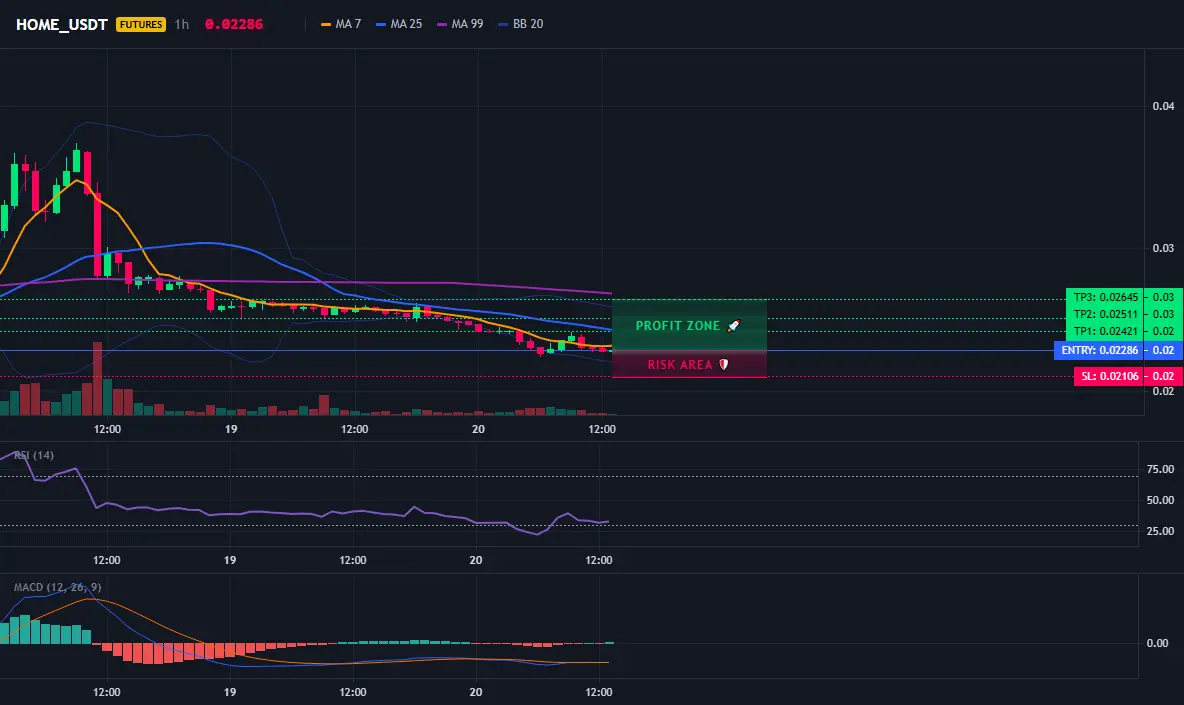
Trading Plan:
Entry: 0.06955 – 0.07049
SL: 0.07457
TP1: 0.06661
TP2: 0.06434
TP3: 0.06092
Why focus on this structure?
- Current EMA and RSI data show that the 15-minute RSI is only 47.49, not yet in oversold territory, and bearish momentum is still accumulating.
- The 1-day trend is range-bound, but the 4-hour direction is clearly SHORT, with entry reference price 0.07002, TP1 at 0.06661, and a risk-reward ratio of about 2:1.
- Why now? RSI is neutral to weak, and the 1-hour ATR is only 0.001895, with low volatility, but the signal is armed, waiting for a breakout.
Discussion:
Will this bearish wave first reach TP1 0.06661, or will it fake out and bounce to 0.07049 before falling?
$H /USDT - Short
Trading Plan:
Entry: 0.06955 – 0.07049
SL: 0.07457
TP1: 0.06661
TP2: 0.06434
TP3: 0.06092
Why focus on this structure?
- Current EMA and RSI data show that the 15-minute RSI is only 47.49, not yet in oversold territory, and bearish momentum is still accumulating.
- The 1-day trend is range-bound, but the 4-hour direction is clearly SHORT, with entry reference price 0.07002, TP1 at 0.06661, and a risk-reward ratio of about 2:1.
- Why now? RSI is neutral to weak, and the 1-hour ATR is only 0.001895, with low volatility, but the signal is armed, waiting for a breakout.
Discussion:
Will this bearish wave first reach TP1 0.06661, or will it fake out and bounce to 0.07049 before falling?