#SummerCreationCamp
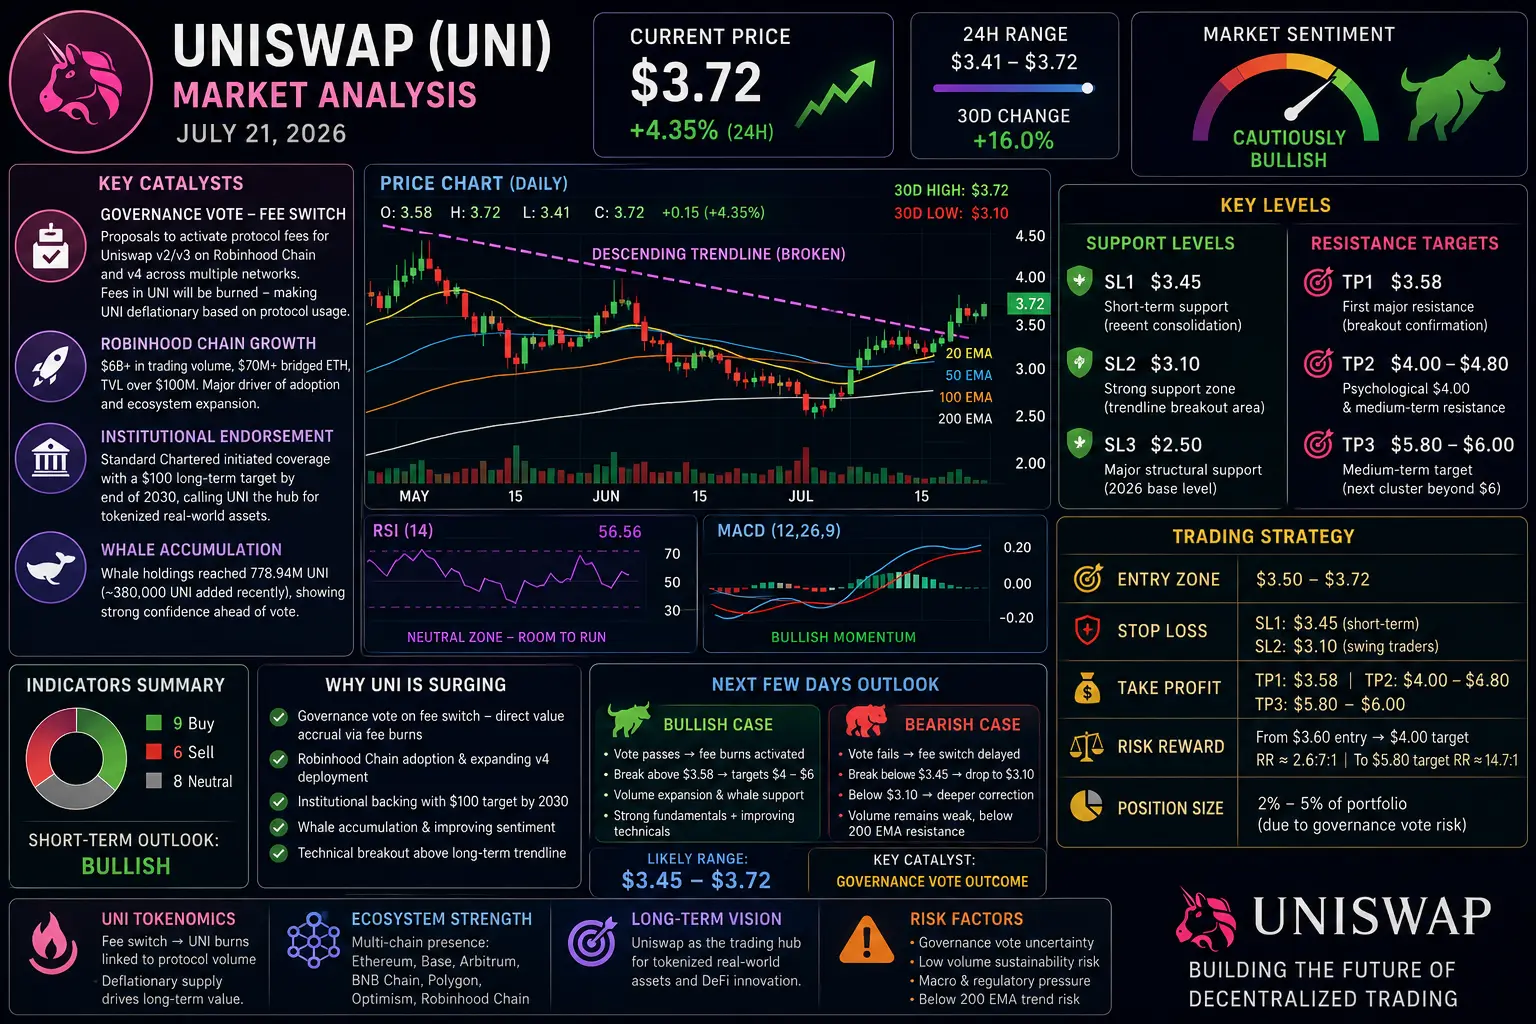
Uniswap (UNI) is currently trading around $3.72, reflecting a significant recovery from recent lows. Over the past 24 hours, UNI has surged approximately 4.35%, building on momentum that has now extended to a 16% gain over the past 30 days. The 24-hour trading range has spanned from $3.41 to $3.72, showing active price discovery as bulls push the token higher. This surge forms part of a broader recovery that began after UNI touched local support near $3.10 earlier in July, supported by increasing volumes and renewed investor interest driven by fundamental catalysts reshaping the token's outlook.
What Is Driving the Surge
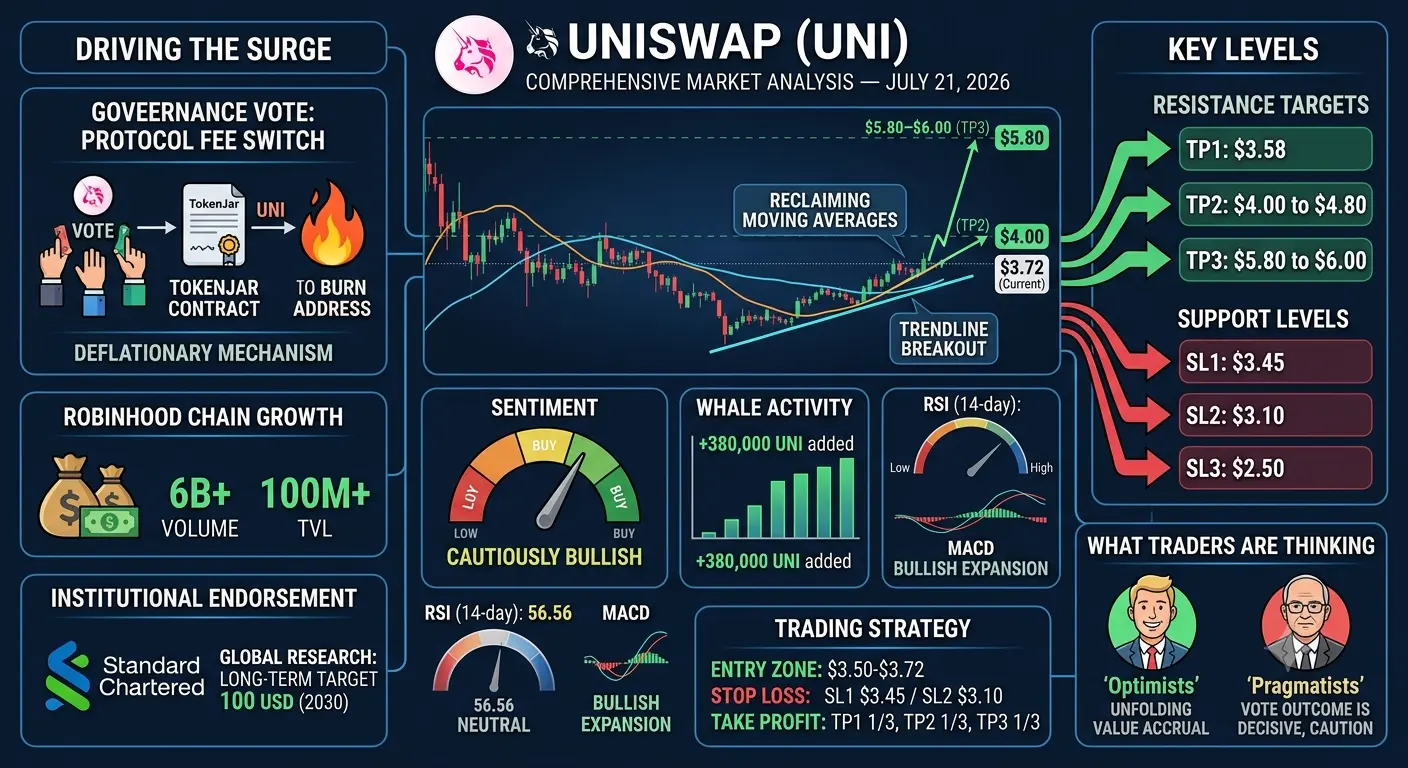
The primary catalyst behind UNI's rally is the governance vote on the protocol fee switch. Two proposals have been submitted for final on-chain voting. The first seeks to activate protocol fees for Uniswap v2 and v3 on Robinhood Chain. The second aims to enable protocol fees for Uniswap v4 across Ethereum, Base, Arbitrum, Robinhood Chain, BNB Chain, Polygon, and Optimism. If approved, protocol fees would be routed through TokenJar contracts, and the resulting UNI would be transferred to Ethereum and sent to the official burn address. This ties UNI's supply directly to protocol activity — the burn rate depends on trading volume across supported deployments. This is transformative for UNI's tokenomics, creating a direct value accrual mechanism that has been missing since inception.
Robinhood Chain has emerged as a major growth driver, processing over 6 billion dollars in Uniswap trading volume, attracting over 70 million dollars in bridged ETH, with total value locked above 100 million dollars. Standard Chartered's Global Research team, led by Geoff Kendrick, initiated coverage with a long-term target of 100 dollars by end of 2030, framing Uniswap as the trading hub for tokenized real-world assets. This institutional endorsement has further strengthened confidence and attracted whale accumulation.
Whale Activity and Trader Sentiment
Whale holdings have risen to 778.94 million UNI, with approximately 380,000 UNI added by large wallets recently. This measured accumulation signals disciplined positioning ahead of the governance vote rather than emotional buying. Among 23 tracked indicators, 9 signal Buy, 6 signal Sell, and 8 are neutral — the short-term reading leans bullish. Earlier in June, UNI surged 24% in a single day driven by whale activity following the Standard Chartered forecast. The broader sentiment is "cautiously bullish" — analysts acknowledge improving fundamentals while noting the recovery remains in its early stages.
Technical Analysis — RSI and Moving Averages
UNI has confirmed a breakout above a long-term descending trendline from mid-2025, reclaiming short-term moving averages with rising volume. The 14-day RSI stands at approximately 56.56, placing it in neutral territory. Buyers have gained momentum, but neither bulls nor bears have complete control. The RSI is well below the overbought zone above 70, leaving meaningful room for continued upside. The reading above 50 confirms genuine buying pressure rather than a short-lived spike.
UNI has moved above its 20-day, 50-day, and 100-day exponential moving averages, indicating stronger short and medium-term momentum. However, it still trades below the 200-day EMA, leaving longer-term resistance intact. The 5-day moving average sits at approximately 3.69, supporting the bullish posture. The MACD on daily charts shows bullish expansion with the MACD line above the signal line and histogram expanding — genuine momentum rather than a tired bounce. On Bollinger Bands, UNI has reclaimed the middle band, confirming improving momentum.
Key Support Levels
SL1: $3.45 — The key short-term support aligning with the recent consolidation zone and lower boundary of the 24-hour range. A break below this weakens the bullish structure and increases downside risk toward the next support zone.
SL2: $3.10 — Strong support during the June-July recovery phase where significant buying emerged and the trendline breakout was confirmed. If SL1 fails, this becomes the next critical defense line.
SL3: $2.50 — Structural support from earlier in 2026 where UNI established its base. A decline here would represent a significant bearish reversal, invalidating the current bullish setup and suggesting a return to the prolonged downtrend.
Key Resistance Targets
TP1: $3.58 — The first major uptrend resistance. A daily close above this strengthens the recovery and confirms genuine breakout follow-through.
TP2: $4.00 to $4.80 — The $4.00 level is a psychological milestone signaling a decisive shift. The $4.80 to $5.00 zone represents medium-term resistance where UNI previously faced strong selling. A weekly close above $4.00 confirms a sustained uptrend.
TP3: $5.80 to $6.00 — The medium-term target identified following the confirmed trendline breakout. Reaching this requires successful governance outcomes and favorable macro conditions. Beyond $6.00, the next cluster sits near $9.50 to $10.00 from the November 2025 fee-switch rally.
Bullish vs Bearish Forecast — Next Few Days
The near-term outlook leans bullish on converging factors. The governance vote is a tangible fundamental catalyst directly impacting UNI's value proposition. If proposals pass, the fee-burn mechanism creates a deflationary supply dynamic tied to protocol usage — a powerful narrative. The trendline breakout, reclaiming of moving averages, and neutral-but-improving RSI support the bullish case. Whale accumulation provides backing from informed participants.
Risks could shift the outlook bearish. The governance vote outcome is uncertain — failed proposals would deflate the fee-switch narrative, potentially triggering a sell-off. Trading volume has shown only negligible uptick in some measurements, raising questions about rally sustainability. UNI still trades below the 200-day EMA, meaning the longer-term trend has not fully reversed. A break below $3.45 weakens bullish structure; losing $3.10 invalidates the recovery setup. Macro risks including geopolitical tensions and regulatory uncertainty around DeFi governance tokens also weigh on sentiment.
UNI is likely to trade between $3.45 and $3.72 as the market awaits governance results. A successful vote could push toward $3.58 to $4.00. A failed vote could trigger a pullback toward $3.10. The asymmetry currently favors bulls because the fundamental catalyst is real and tangible while technical momentum is improving but not overextended.
Trading Strategy
Entry Zone: Between $3.50 and $3.72 offers reasonable entry for medium-term positions. Conservative traders may wait for a confirmed daily close above $3.58 for stronger breakout conviction.
Position Sizing: Given the binary nature of the governance catalyst, keep positions moderate — 2 to 5 percent of portfolio allocation — to account for possible vote failure triggering a sharp reversal.
Stop Loss: SL1 at $3.45 for short-term trades. SL2 at $3.10 for swing traders with wider tolerance for volatility while protecting against genuine trend reversal.
Profit Targets: TP1 at $3.58 — take partial profits, reduce risk. TP2 at $4.00 to $4.80 — significant profit-taking zone. TP3 at $5.80 to $6.00 — extended target for traders holding through governance outcome and subsequent momentum.
Risk-Reward: From entry around $3.60 with stop at $3.45 and first target at $4.00, the ratio is approximately 2.67:1 (40 cents profit versus 15 cents risk). Extending to $5.80 improves to approximately 14.7:1, though probability is lower.
What Traders Are Thinking
The community is divided between optimists seeing the governance vote as a transformative catalyst and pragmatists cautioning that the fee switch has been discussed for years without implementation. Optimists are accumulating, betting that successful implementation would unlock a new era of value accrual, potentially driving UNI toward $5 to $6. They point to Robinhood Chain growth, expanding v4 deployment, and Standard Chartered's endorsement as evidence of an ecosystem growth phase.
Pragmatists acknowledge the improving setup but note that similar catalyst-driven rallies have faded before without sustained follow-through. They emphasize that volume needs to expand more substantially to confirm genuine demand. They watch $3.58 closely — a convincing break with volume expansion would shift their stance from cautious to constructive. Until then, they prefer small positions with tight stops.
Both camps agree: the governance vote outcome is the decisive factor for UNI's trajectory. A successful vote would trigger accelerated buying as the fee-burn narrative gains attention, while a failed vote could prompt a sharp correction as disappointed sellers exit.
Conclusion
UNI stands at an inflection point where fundamental catalysts and improving technicals converge. The current price around $3.72 reflects meaningful recovery driven by governance proposals that could reshape tokenomics through protocol fee burns. The technical setup shows a confirmed trendline breakout, improving moving average alignment, and neutral-but-positive RSI. Support at $3.45 and resistance at $3.58 define the immediate range, with medium-term targets toward $4.00 to $6.00 if bullish conditions persist. Approach with disciplined risk management using defined stops and targets, while remaining attentive to the governance vote as the primary catalyst determining whether the bullish recovery continues or reverses.
#UNI @Gate_Square
Uniswap (UNI) is currently trading around $3.72, reflecting a significant recovery from recent lows. Over the past 24 hours, UNI has surged approximately 4.35%, building on momentum that has now extended to a 16% gain over the past 30 days. The 24-hour trading range has spanned from $3.41 to $3.72, showing active price discovery as bulls push the token higher. This surge forms part of a broader recovery that began after UNI touched local support near $3.10 earlier in July, supported by increasing volumes and renewed investor interest driven by fundamental catalysts reshaping the token's outlook.
What Is Driving the Surge
The primary catalyst behind UNI's rally is the governance vote on the protocol fee switch. Two proposals have been submitted for final on-chain voting. The first seeks to activate protocol fees for Uniswap v2 and v3 on Robinhood Chain. The second aims to enable protocol fees for Uniswap v4 across Ethereum, Base, Arbitrum, Robinhood Chain, BNB Chain, Polygon, and Optimism. If approved, protocol fees would be routed through TokenJar contracts, and the resulting UNI would be transferred to Ethereum and sent to the official burn address. This ties UNI's supply directly to protocol activity — the burn rate depends on trading volume across supported deployments. This is transformative for UNI's tokenomics, creating a direct value accrual mechanism that has been missing since inception.
Robinhood Chain has emerged as a major growth driver, processing over 6 billion dollars in Uniswap trading volume, attracting over 70 million dollars in bridged ETH, with total value locked above 100 million dollars. Standard Chartered's Global Research team, led by Geoff Kendrick, initiated coverage with a long-term target of 100 dollars by end of 2030, framing Uniswap as the trading hub for tokenized real-world assets. This institutional endorsement has further strengthened confidence and attracted whale accumulation.
Whale Activity and Trader Sentiment
Whale holdings have risen to 778.94 million UNI, with approximately 380,000 UNI added by large wallets recently. This measured accumulation signals disciplined positioning ahead of the governance vote rather than emotional buying. Among 23 tracked indicators, 9 signal Buy, 6 signal Sell, and 8 are neutral — the short-term reading leans bullish. Earlier in June, UNI surged 24% in a single day driven by whale activity following the Standard Chartered forecast. The broader sentiment is "cautiously bullish" — analysts acknowledge improving fundamentals while noting the recovery remains in its early stages.
Technical Analysis — RSI and Moving Averages
UNI has confirmed a breakout above a long-term descending trendline from mid-2025, reclaiming short-term moving averages with rising volume. The 14-day RSI stands at approximately 56.56, placing it in neutral territory. Buyers have gained momentum, but neither bulls nor bears have complete control. The RSI is well below the overbought zone above 70, leaving meaningful room for continued upside. The reading above 50 confirms genuine buying pressure rather than a short-lived spike.
UNI has moved above its 20-day, 50-day, and 100-day exponential moving averages, indicating stronger short and medium-term momentum. However, it still trades below the 200-day EMA, leaving longer-term resistance intact. The 5-day moving average sits at approximately 3.69, supporting the bullish posture. The MACD on daily charts shows bullish expansion with the MACD line above the signal line and histogram expanding — genuine momentum rather than a tired bounce. On Bollinger Bands, UNI has reclaimed the middle band, confirming improving momentum.
Key Support Levels
SL1: $3.45 — The key short-term support aligning with the recent consolidation zone and lower boundary of the 24-hour range. A break below this weakens the bullish structure and increases downside risk toward the next support zone.
SL2: $3.10 — Strong support during the June-July recovery phase where significant buying emerged and the trendline breakout was confirmed. If SL1 fails, this becomes the next critical defense line.
SL3: $2.50 — Structural support from earlier in 2026 where UNI established its base. A decline here would represent a significant bearish reversal, invalidating the current bullish setup and suggesting a return to the prolonged downtrend.
Key Resistance Targets
TP1: $3.58 — The first major uptrend resistance. A daily close above this strengthens the recovery and confirms genuine breakout follow-through.
TP2: $4.00 to $4.80 — The $4.00 level is a psychological milestone signaling a decisive shift. The $4.80 to $5.00 zone represents medium-term resistance where UNI previously faced strong selling. A weekly close above $4.00 confirms a sustained uptrend.
TP3: $5.80 to $6.00 — The medium-term target identified following the confirmed trendline breakout. Reaching this requires successful governance outcomes and favorable macro conditions. Beyond $6.00, the next cluster sits near $9.50 to $10.00 from the November 2025 fee-switch rally.
Bullish vs Bearish Forecast — Next Few Days
The near-term outlook leans bullish on converging factors. The governance vote is a tangible fundamental catalyst directly impacting UNI's value proposition. If proposals pass, the fee-burn mechanism creates a deflationary supply dynamic tied to protocol usage — a powerful narrative. The trendline breakout, reclaiming of moving averages, and neutral-but-improving RSI support the bullish case. Whale accumulation provides backing from informed participants.
Risks could shift the outlook bearish. The governance vote outcome is uncertain — failed proposals would deflate the fee-switch narrative, potentially triggering a sell-off. Trading volume has shown only negligible uptick in some measurements, raising questions about rally sustainability. UNI still trades below the 200-day EMA, meaning the longer-term trend has not fully reversed. A break below $3.45 weakens bullish structure; losing $3.10 invalidates the recovery setup. Macro risks including geopolitical tensions and regulatory uncertainty around DeFi governance tokens also weigh on sentiment.
UNI is likely to trade between $3.45 and $3.72 as the market awaits governance results. A successful vote could push toward $3.58 to $4.00. A failed vote could trigger a pullback toward $3.10. The asymmetry currently favors bulls because the fundamental catalyst is real and tangible while technical momentum is improving but not overextended.
Trading Strategy
Entry Zone: Between $3.50 and $3.72 offers reasonable entry for medium-term positions. Conservative traders may wait for a confirmed daily close above $3.58 for stronger breakout conviction.
Position Sizing: Given the binary nature of the governance catalyst, keep positions moderate — 2 to 5 percent of portfolio allocation — to account for possible vote failure triggering a sharp reversal.
Stop Loss: SL1 at $3.45 for short-term trades. SL2 at $3.10 for swing traders with wider tolerance for volatility while protecting against genuine trend reversal.
Profit Targets: TP1 at $3.58 — take partial profits, reduce risk. TP2 at $4.00 to $4.80 — significant profit-taking zone. TP3 at $5.80 to $6.00 — extended target for traders holding through governance outcome and subsequent momentum.
Risk-Reward: From entry around $3.60 with stop at $3.45 and first target at $4.00, the ratio is approximately 2.67:1 (40 cents profit versus 15 cents risk). Extending to $5.80 improves to approximately 14.7:1, though probability is lower.
What Traders Are Thinking
The community is divided between optimists seeing the governance vote as a transformative catalyst and pragmatists cautioning that the fee switch has been discussed for years without implementation. Optimists are accumulating, betting that successful implementation would unlock a new era of value accrual, potentially driving UNI toward $5 to $6. They point to Robinhood Chain growth, expanding v4 deployment, and Standard Chartered's endorsement as evidence of an ecosystem growth phase.
Pragmatists acknowledge the improving setup but note that similar catalyst-driven rallies have faded before without sustained follow-through. They emphasize that volume needs to expand more substantially to confirm genuine demand. They watch $3.58 closely — a convincing break with volume expansion would shift their stance from cautious to constructive. Until then, they prefer small positions with tight stops.
Both camps agree: the governance vote outcome is the decisive factor for UNI's trajectory. A successful vote would trigger accelerated buying as the fee-burn narrative gains attention, while a failed vote could prompt a sharp correction as disappointed sellers exit.
Conclusion
UNI stands at an inflection point where fundamental catalysts and improving technicals converge. The current price around $3.72 reflects meaningful recovery driven by governance proposals that could reshape tokenomics through protocol fee burns. The technical setup shows a confirmed trendline breakout, improving moving average alignment, and neutral-but-positive RSI. Support at $3.45 and resistance at $3.58 define the immediate range, with medium-term targets toward $4.00 to $6.00 if bullish conditions persist. Approach with disciplined risk management using defined stops and targets, while remaining attentive to the governance vote as the primary catalyst determining whether the bullish recovery continues or reverses.
#UNI @Gate_Square