💰 $RIF BREAKOUT TRADING SETUP
🔼 LONG
✳️ ENTRY: 0.08300 – 0.07933 – 0.07566
🎯 TARGETS: 0.08600, 0.09200, 0.099, 0.10700, 0.12000, 0.1500, 0.20000
🀄️ LEVERAGE: 10x
🔴 STOPLOSS: 0.07400
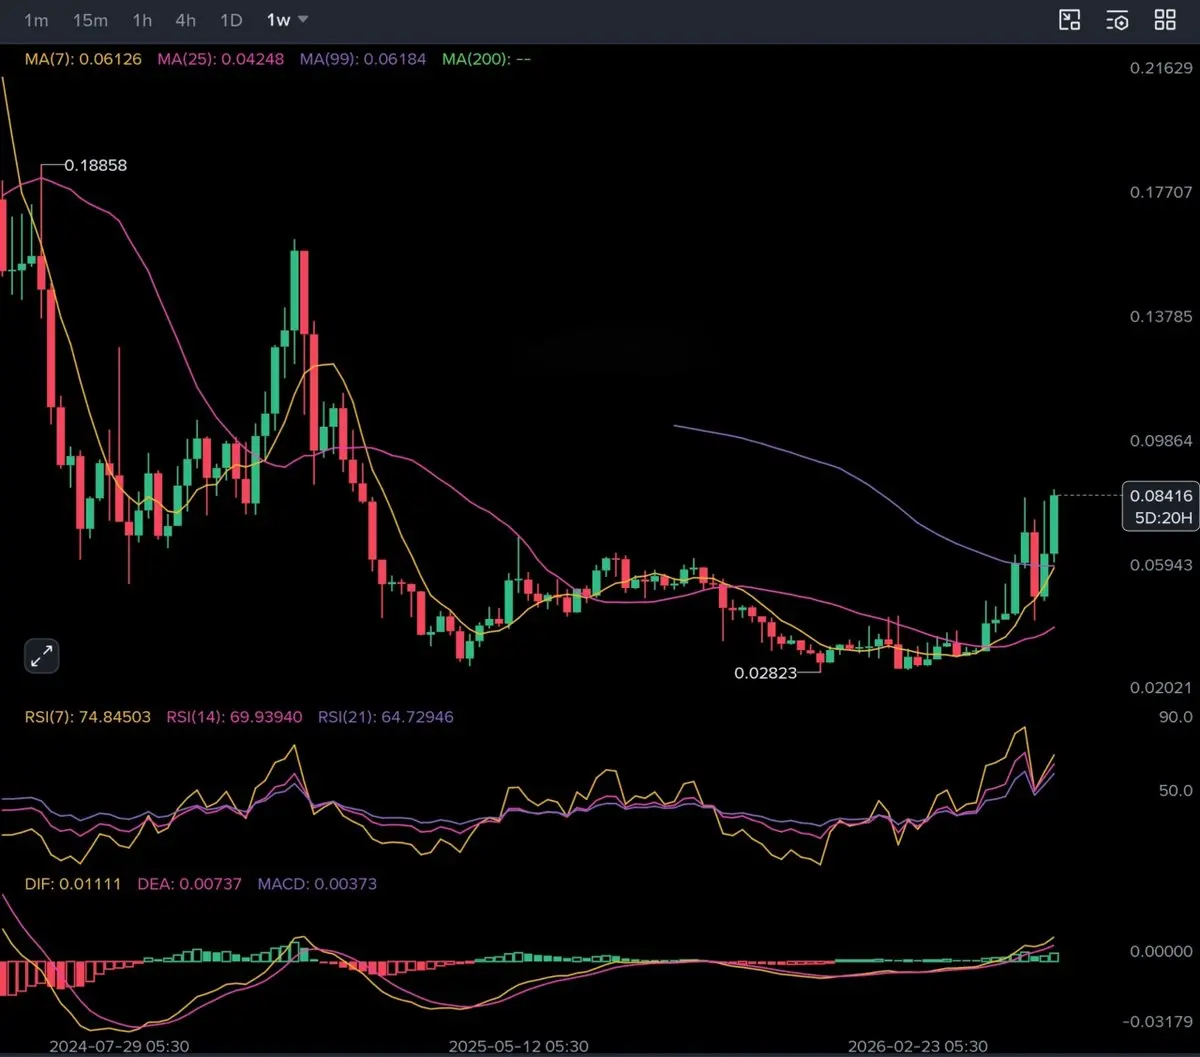
$RIF is showing a powerful multi-timeframe breakout after spending months in accumulation. On the 1W chart, one of the most important developments is the MA7 crossing above MA99, a strong signal that long-term momentum is shifting from bearish to bullish. This crossover is supported by a bullish weekly MACD expansion and RSI breaking into strong bullish territory.
Price has successfully reclaimed both MA25 and MA99 on the weekly timeframe while breaking out from a large accumulation structure that has been forming since the major decline from the 0.18 region. Historically, this combination often marks the beginning of a new trend cycle.
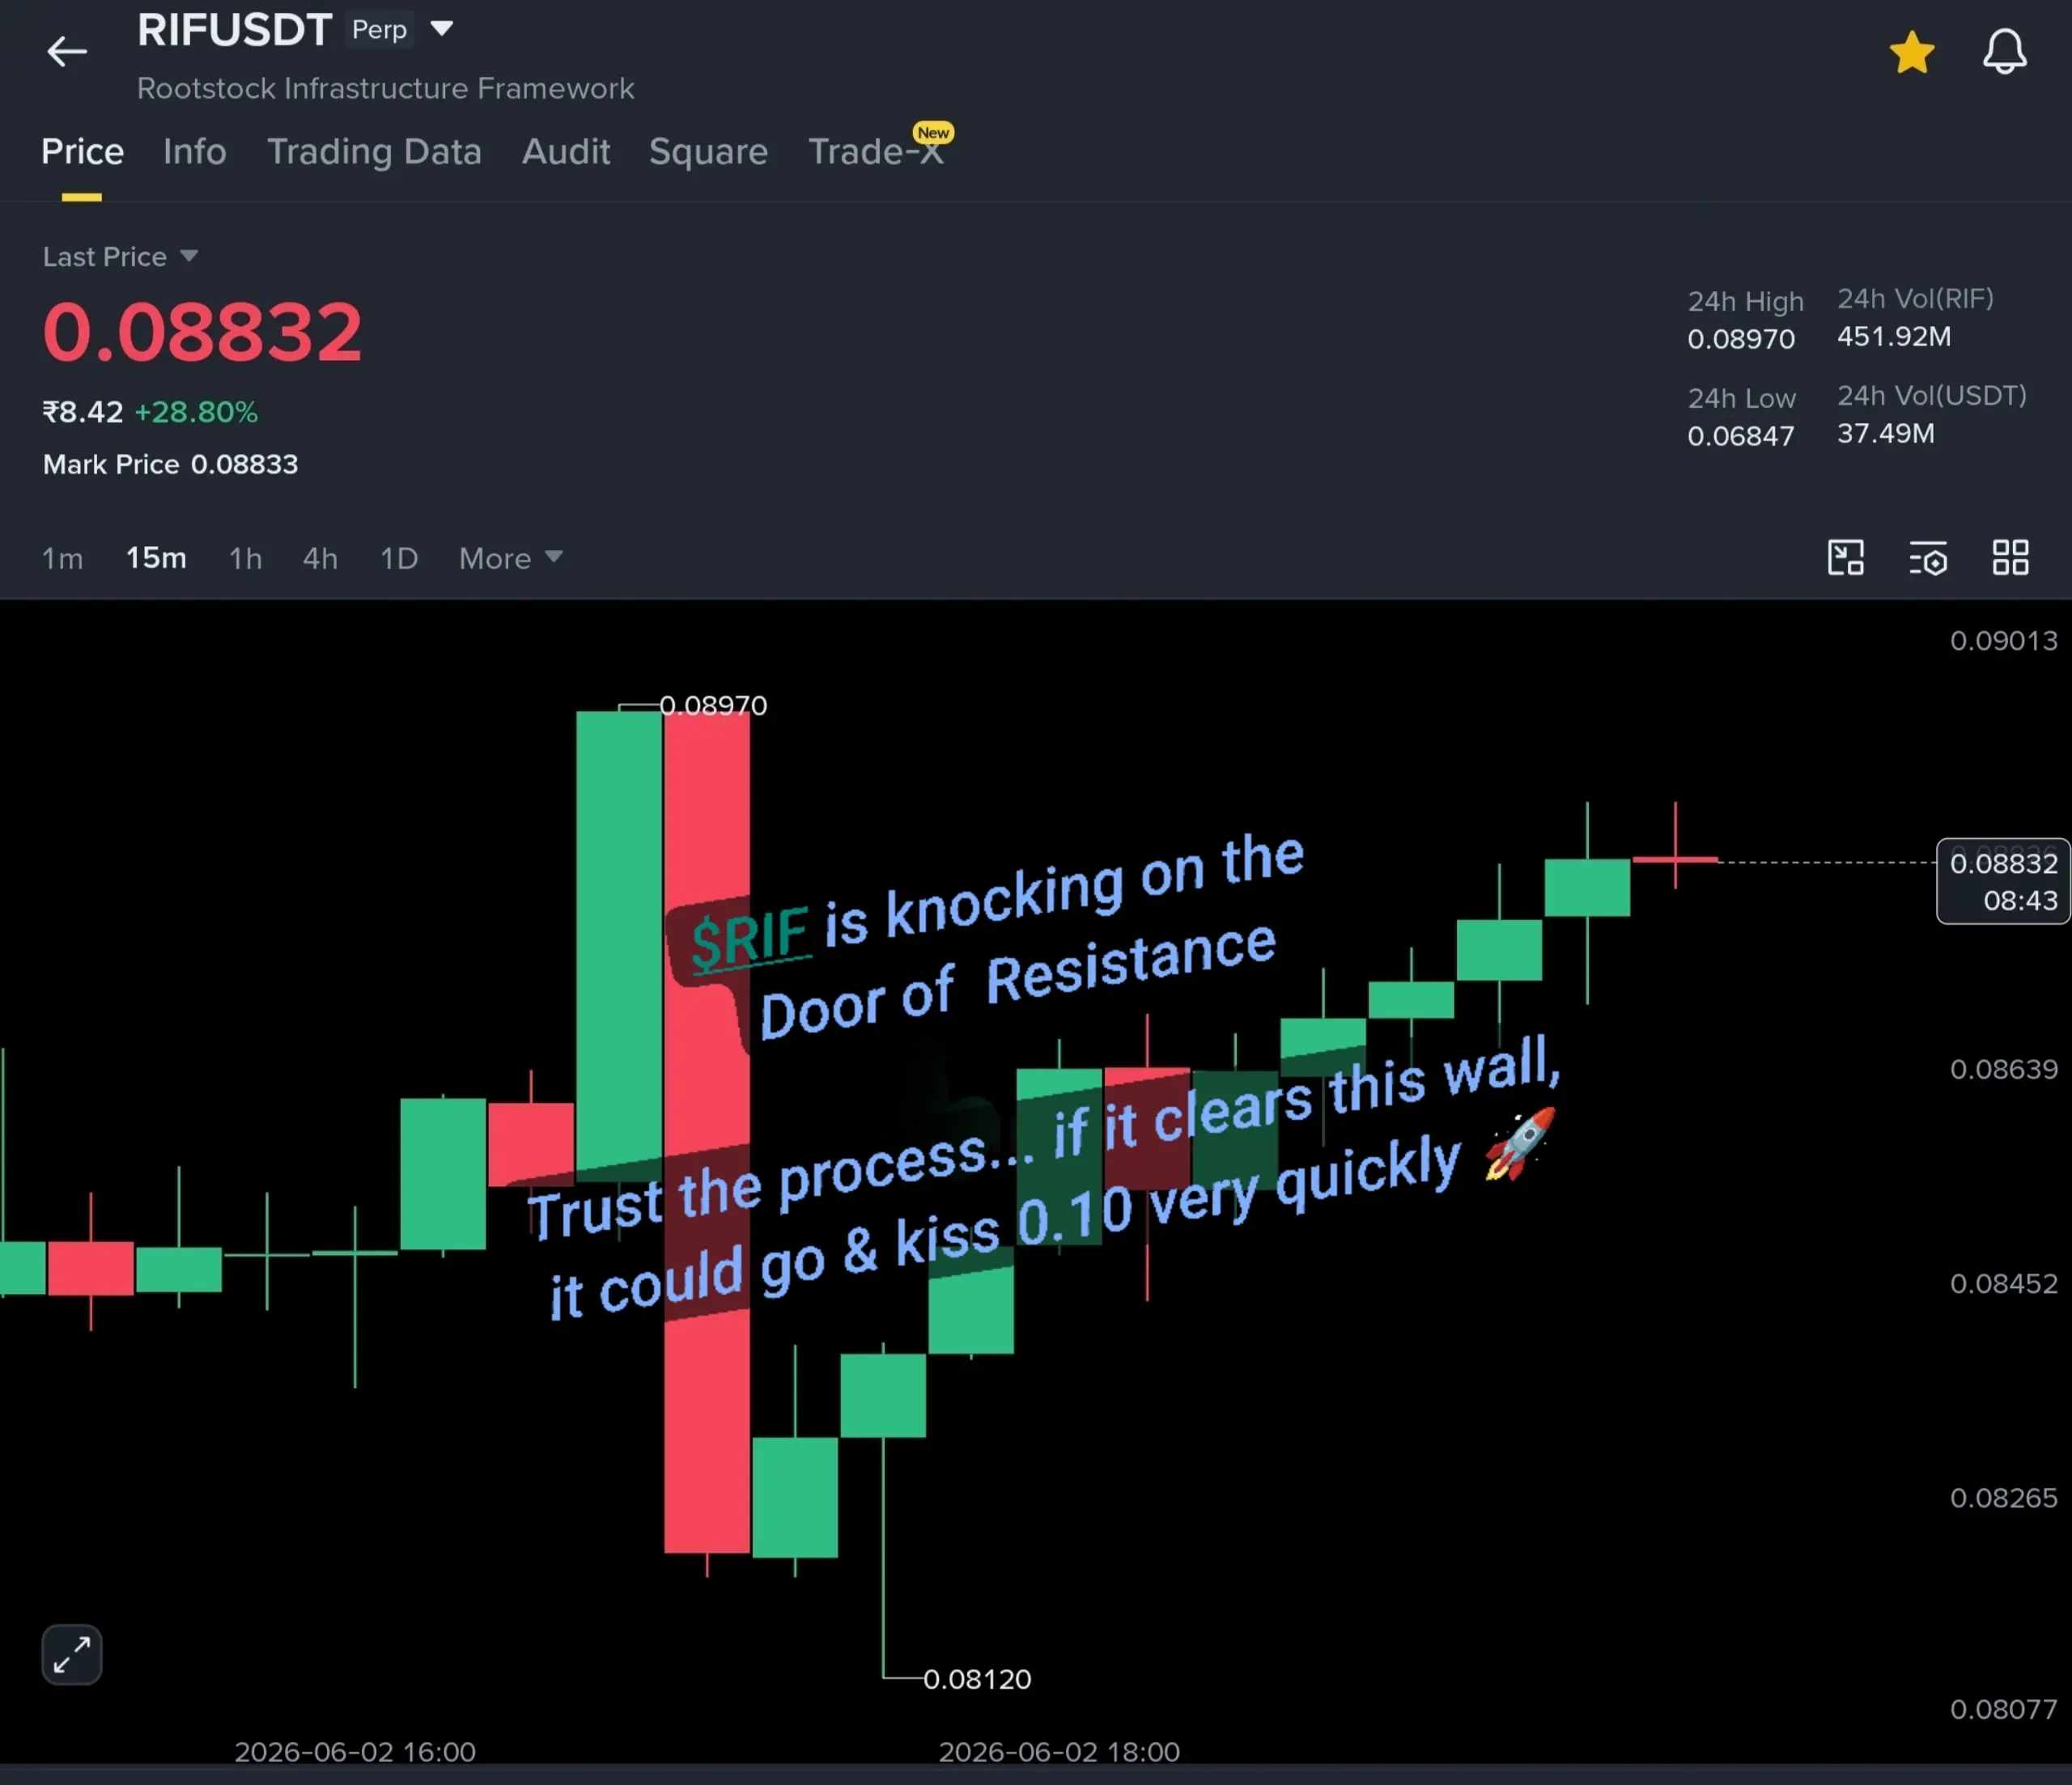
On the 4H chart, $RIF has broken above the critical 0.0800 resistance zone, printing a fresh local high around 0.0860. The breakout occurred with strong momentum, and buyers are currently defending the breakout level rather than allowing a deep retracement.
The key support zone now sits between 0.0800–0.0830. As long as price maintains healthy consolidation above this area, the bullish structure remains intact. A successful retest could provide fuel for the next expansion leg toward higher targets.
With the weekly trend turning bullish, MACD strengthening, RSI holding strong, and MA7 leading above MA99, $RIF is positioned for potential continuation toward the 0.10–0.20 region over the coming weeks.
Manage risk properly and consider moving stop-loss to entry after securing profits on early targets. 🚀
🔼 LONG
✳️ ENTRY: 0.08300 – 0.07933 – 0.07566
🎯 TARGETS: 0.08600, 0.09200, 0.099, 0.10700, 0.12000, 0.1500, 0.20000
🀄️ LEVERAGE: 10x
🔴 STOPLOSS: 0.07400
$RIF is showing a powerful multi-timeframe breakout after spending months in accumulation. On the 1W chart, one of the most important developments is the MA7 crossing above MA99, a strong signal that long-term momentum is shifting from bearish to bullish. This crossover is supported by a bullish weekly MACD expansion and RSI breaking into strong bullish territory.
Price has successfully reclaimed both MA25 and MA99 on the weekly timeframe while breaking out from a large accumulation structure that has been forming since the major decline from the 0.18 region. Historically, this combination often marks the beginning of a new trend cycle.
On the 4H chart, $RIF has broken above the critical 0.0800 resistance zone, printing a fresh local high around 0.0860. The breakout occurred with strong momentum, and buyers are currently defending the breakout level rather than allowing a deep retracement.
The key support zone now sits between 0.0800–0.0830. As long as price maintains healthy consolidation above this area, the bullish structure remains intact. A successful retest could provide fuel for the next expansion leg toward higher targets.
With the weekly trend turning bullish, MACD strengthening, RSI holding strong, and MA7 leading above MA99, $RIF is positioned for potential continuation toward the 0.10–0.20 region over the coming weeks.
Manage risk properly and consider moving stop-loss to entry after securing profits on early targets. 🚀