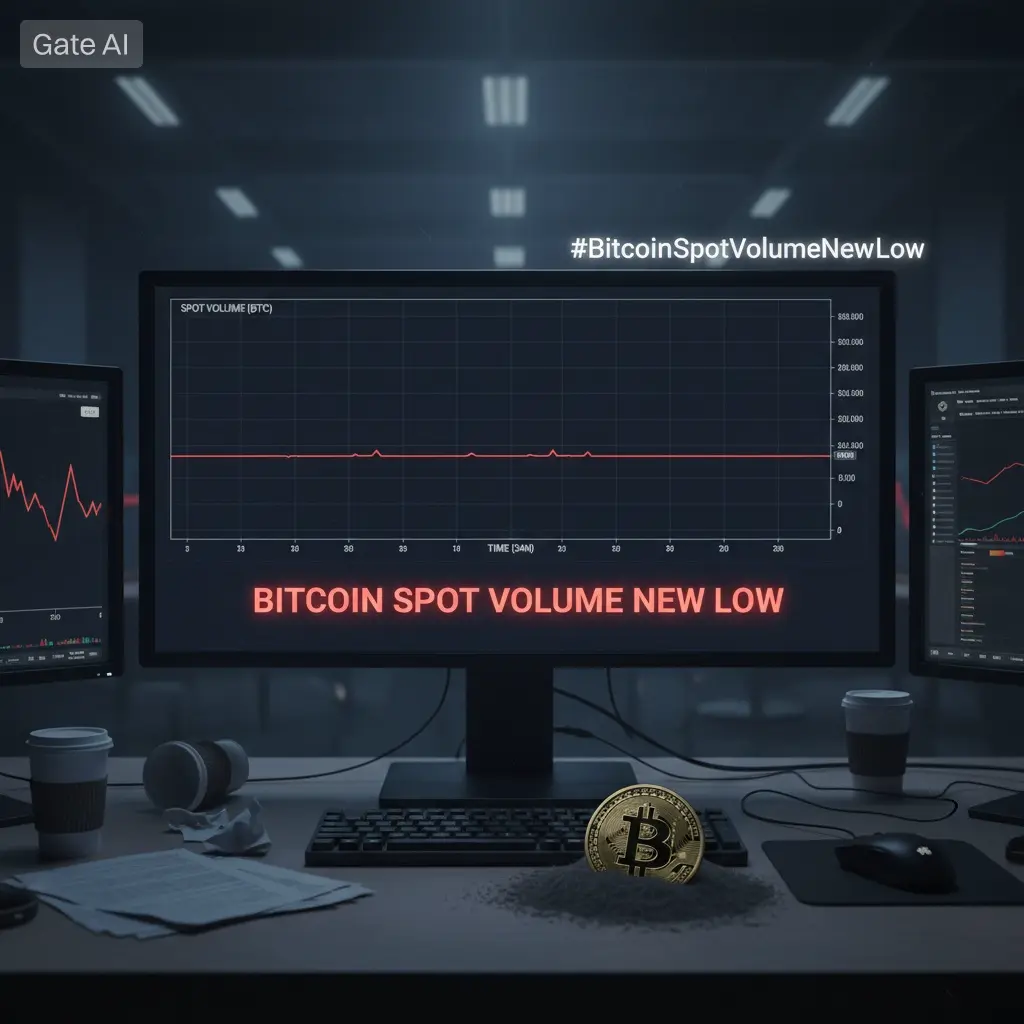
#BitcoinSpotVolumeNewLow
INTRODUCTION: THE QUIET SIGNAL THAT PRECEDES BIG MARKET MOVES
In May 2026, Bitcoin is displaying one of the most important yet under-discussed structural conditions in modern crypto market cycles:
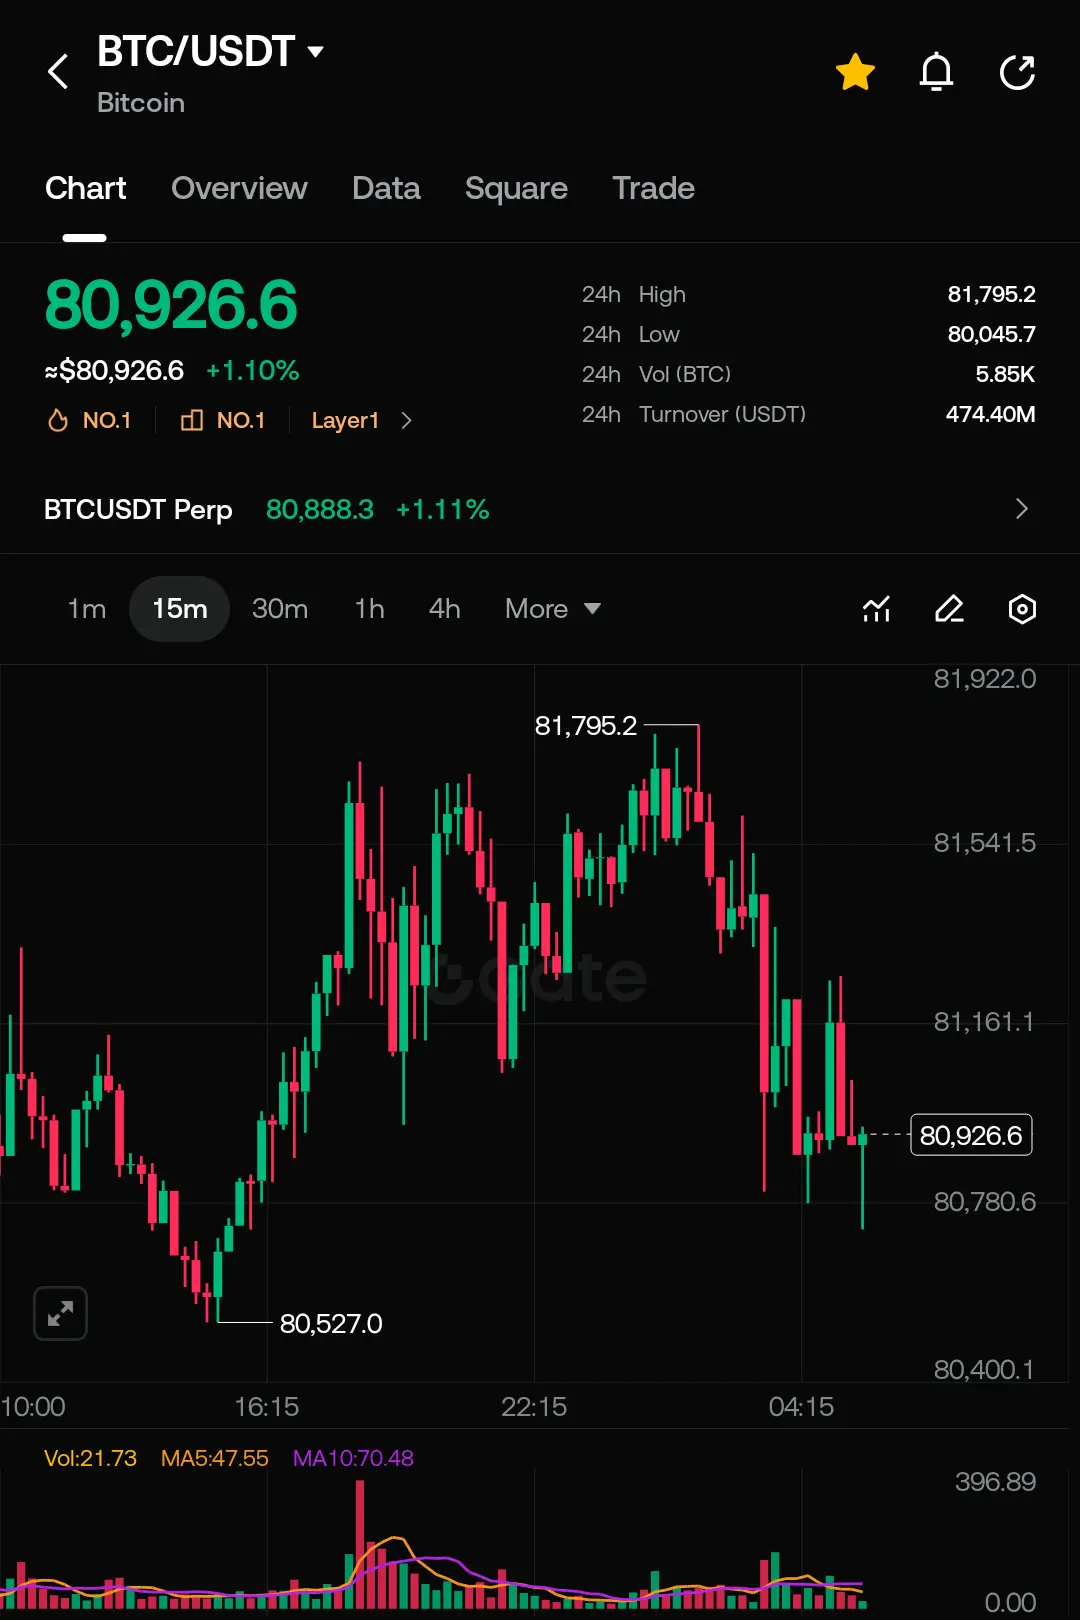
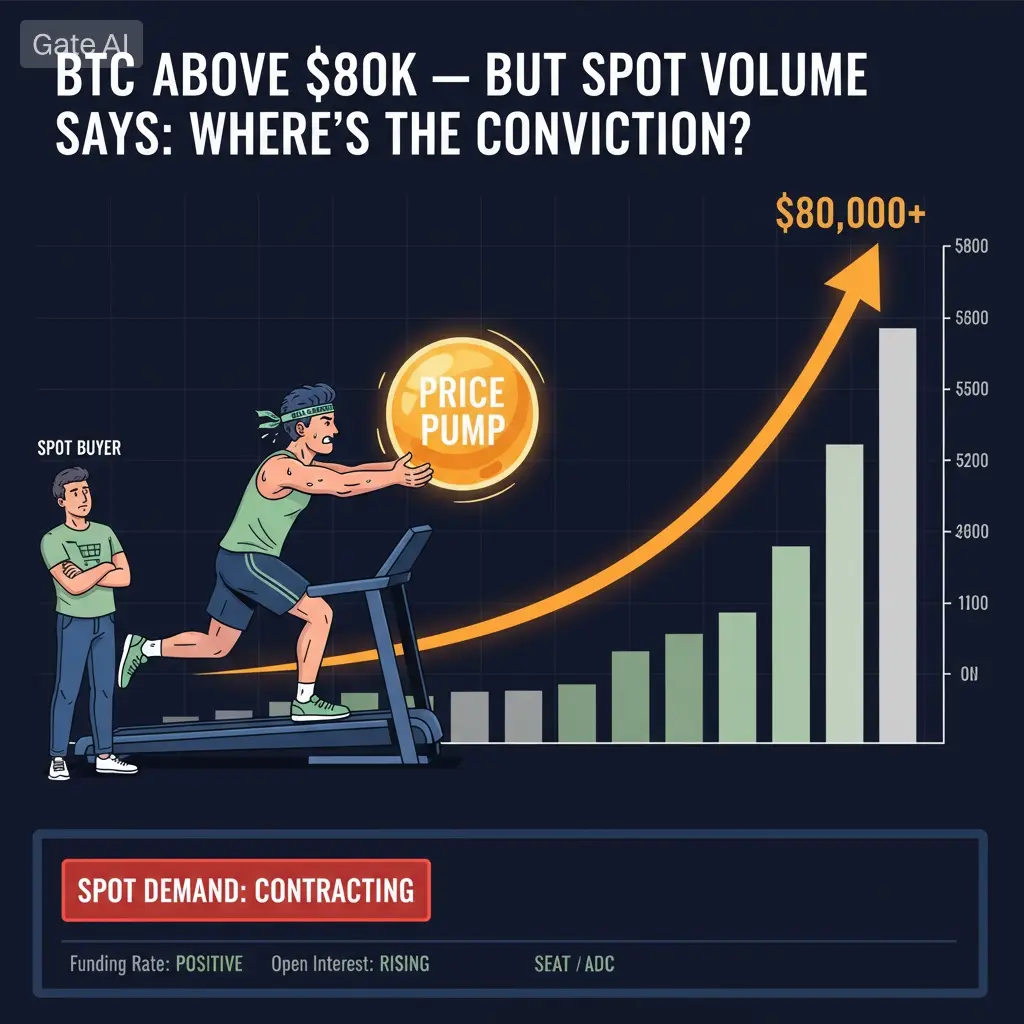
While price remains relatively stable in the $78,000 to $82,500 consolidation zone, spot trading volume has dropped to multi-week lows across major exchanges.
This divergence between stable price action and declining real market participation is not just a statistical anomaly — it reflects a deeper liquidity contraction phase occurring beneath the surface of the market structure.
Historically, such phases rarely persist for long.
They tend to precede: Strong directional breakouts
Volatility expansion cycles
Liquidity-driven stop hunts
Institutional re-positioning phases
Macro-driven trend shifts
The critical point is not price stability — but the weakening depth of real participation supporting that price.
SPOT VOLUME DEFINITION: WHY IT MATTERS MORE THAN PRICE
Spot volume represents actual Bitcoin bought and sold without leverage. It reflects: Real buyer demand
Real seller distribution
Organic capital inflow
Genuine market participation
Unlike derivatives markets, spot markets cannot be inflated through leverage or synthetic exposure. This makes spot volume one of the purest indicators of:
“True conviction in the market”
When spot volume declines while price holds steady, it usually indicates participation fatigue or liquidity compression rather than healthy accumulation alone.
CURRENT MARKET STRUCTURE (MAY 2026)
Bitcoin Price: ~$78K – $82.5K
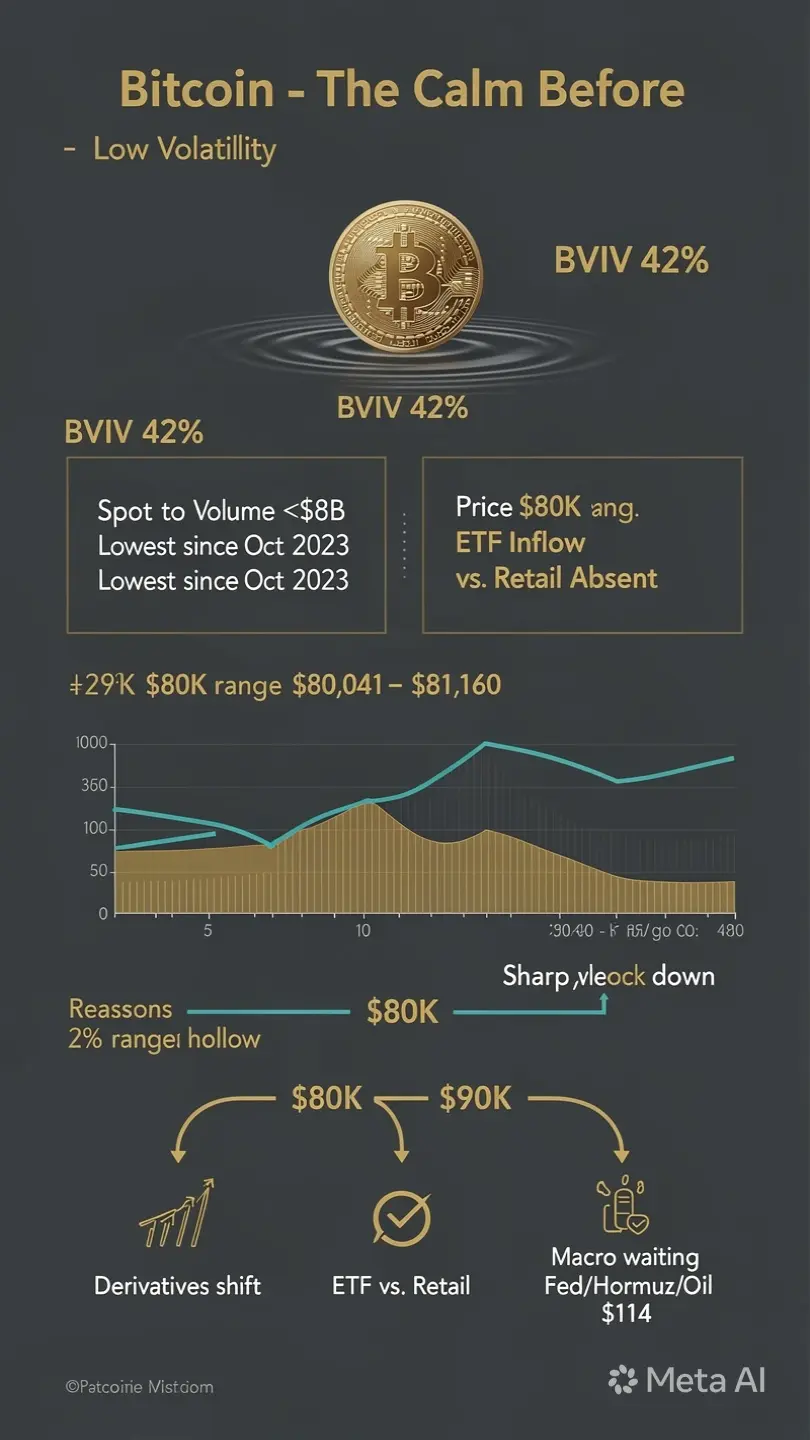
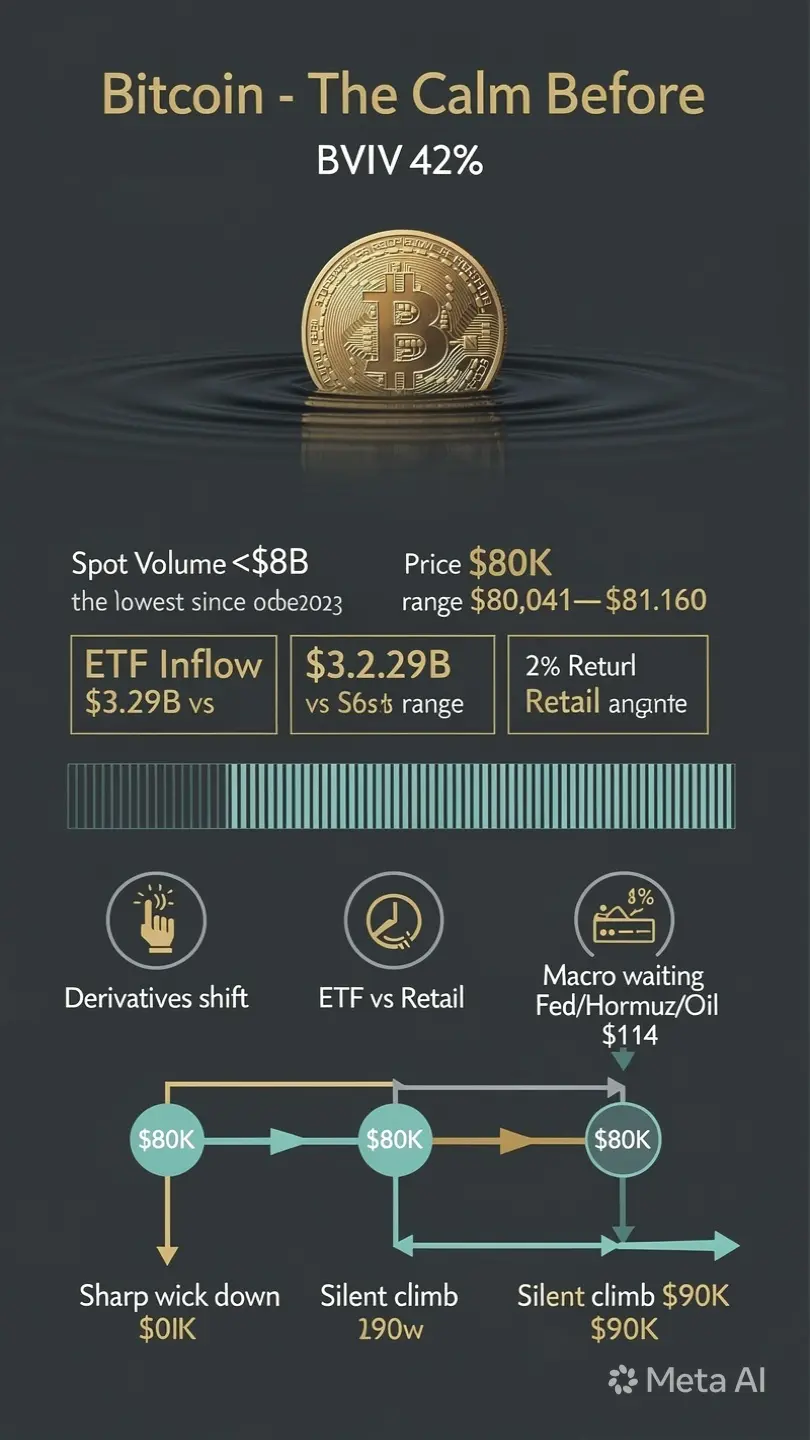
Spot Volume: ↓ 30%–55% below 90-day average
Volatility: Compressed
Futures Open Interest: Stable to slightly elevated
Order Book Depth: Gradually thinning on spot side
Liquidity Behavior: Increasingly passive
This environment defines what professionals often describe as:
“Low Participation Equilibrium Phase”
A state where price remains stable, but underlying market engagement weakens.
WHY SPOT VOLUME IS DECLINING (STRUCTURAL DRIVERS)
1. GLOBAL MACRO LIQUIDITY DEFENSIVE MODE
Global capital conditions remain cautious: Uncertain interest rate direction
Mixed inflation expectations
Geopolitical risk fluctuations
Uneven institutional inflows
Result: capital prefers preservation over deployment.
Spot markets feel this first due to direct capital requirement.
2. POST-RALLY SUPPLY ABSORPTION PHASE
Following previous expansion cycles: Early investors realized profits
Long-term holders slowed accumulation
Market absorbed large supply blocks
This naturally reduces turnover and spot activity.
3. DERIVATIVES-LED MARKET DOMINANCE
A structural shift continues in 2026: Futures markets dominate short-term trading
Leverage replaces spot positioning
Hedging becomes more common than accumulation
Liquidity is increasingly synthetic rather than organic
Result:
Spot exchanges show reduced activity despite active market speculation elsewhere.
4. RETAIL PARTICIPATION COOLDOWN
Retail-driven volume is weakening due to: Sideways price frustration
Lack of breakout confirmation
Fear of false moves
Reduced social momentum
This creates a natural decline in organic demand.
5. INSTITUTIONAL ACCUMULATION SHIFT (OFF-EXCHANGE FLOW)
Institutions continue participating, but differently: Execution via OTC desks
Avoidance of visible exchange order books
Algorithmic staggered accumulation
Long-duration positioning strategies
This results in: Lower visible spot volume despite ongoing accumulation pressure.
MICROSTRUCTURE ANALYSIS (ORDER BOOK DYNAMICS)
ORDER BOOK CONDITIONS
Liquidity thinning below $78K support
Heavy resistance liquidity near $82K–$83K
Reduced passive limit orders on both sides
Increased sensitivity to low-volume moves
MARKET MAKER BEHAVIOR
In low-volume environments, market makers typically: Widen spreads
Reduce liquidity provision
Exploit stop clusters
Amplify small flows into larger moves
This increases the probability of: Sharp wicks
False breakouts
Liquidity sweeps
ON-CHAIN BEHAVIOR SIGNALS (STRUCTURAL SUPPORT)
Typical accompanying on-chain conditions include: Declining exchange inflows
Rising dormant supply
Stable long-term holder conviction
Reduced retail transaction activity
Neutral funding rates
Interpretation: The market is not exiting — it is compressing into inactivity.
PRICE STRUCTURE IMPACT
Low spot volume creates a fragile equilibrium:
1. WEAK PRICE FOUNDATION
Small orders can disproportionately move price.
2. FALSE BREAKOUT ENVIRONMENT
Low liquidity allows temporary directional spikes
.
3. LIQUIDITY SWEEP CONDITIONS
Price tends to: Break below support to trap longs
Break above resistance to trap shorts
4. VOLATILITY COMPRESSION
Energy builds internally like a coiled spring.
WHY THIS PHASE MATTERS MORE THAN IT LOOKS
Historically, low participation phases often act as:
Pre-volatility expansion zones
Re-accumulation structures
Macro decision points
The market is not inactive — it is transitioning.
CATALYSTS FOR SPOT VOLUME RECOVERY
1. MACRO LIQUIDITY EXPANSION
Interest rate easing
Inflation stabilization
Risk-on sentiment return
2. INSTITUTIONAL ETF FLOW ACCELERATION
Sustained inflows
Reduced redemption pressure
Large capital allocations
3. TECHNICAL BREAKOUT CONFIRMATION
Break above $83K with strong volume
Acceptance above resistance level
Momentum participation returns
4. RETAIL RE-ENTRY CYCLE
Social engagement revival
Increased FOMO behavior
Exchange onboarding spikes
5. MARKET INFRASTRUCTURE INCENTIVES
Lower trading fees
Exchange campaigns
Regional adoption growth
TRADING STRATEGY IN LOW VOLUME CONDITIONS
1. AVOID OVER-LEVERAGE
Low liquidity increases: Slippage risk
Stop hunting probability
False move frequency
2. RANGE-BOUND STRUCTURE TRADING
Key levels: Support: $78K
Resistance: $82K–$83K
Focus on reaction-based trading.
3. DIVERGENCE MONITORING
Critical signal: Rising futures open interest + falling spot volume
= potential liquidation-driven expansion move
4. ACCUMULATION APPROACH (LONG-TERM)
Gradual entry strategy
DCA into weakness zones
Avoid emotional positioning
5. RISK MANAGEMENT PRIORITY
Wider stops required
Smaller position sizing
Avoid chasing volatility spikes
SCENARIO OUTLOOK
BULLISH EXPANSION CASE
Spot volume returns
Break above $83K
Momentum acceleration
Target: $88K – $92K
BEARISH LIQUIDITY BREAKDOWN
Continued volume decline
Break below $78K
Move toward $72K – $75K
BASE CASE (MOST LIKELY)
Extended consolidation between $75K–$83K
Low participation continues
Market waits for catalyst
FINAL STRUCTURE CONCLUSION
Bitcoin’s current environment is defined not by fear or euphoria — but by liquidity compression and participation decline.
Key insight: Price stability is masking weakening underlying engagement.
This phase represents: Institutional patience
Retail hesitation
Derivatives dominance
Spot market inactivity
Historically, such conditions do not mark the end of a trend — but rather the buildup phase before volatility expansion.
FINAL THOUGHT
The Bitcoin market in May 2026 is effectively operating in a low participation equilibrium structure.
No major breakdown is confirmed yet — but internal energy is accumulating.
The next major directional move will depend on one key factor: Return of real spot demand and liquidity expansion.
Until then, disciplined positioning and structural awareness remain the dominant edge in the market.
INTRODUCTION: THE QUIET SIGNAL THAT PRECEDES BIG MARKET MOVES
In May 2026, Bitcoin is displaying one of the most important yet under-discussed structural conditions in modern crypto market cycles:
While price remains relatively stable in the $78,000 to $82,500 consolidation zone, spot trading volume has dropped to multi-week lows across major exchanges.
This divergence between stable price action and declining real market participation is not just a statistical anomaly — it reflects a deeper liquidity contraction phase occurring beneath the surface of the market structure.
Historically, such phases rarely persist for long.
They tend to precede: Strong directional breakouts
Volatility expansion cycles
Liquidity-driven stop hunts
Institutional re-positioning phases
Macro-driven trend shifts
The critical point is not price stability — but the weakening depth of real participation supporting that price.
SPOT VOLUME DEFINITION: WHY IT MATTERS MORE THAN PRICE
Spot volume represents actual Bitcoin bought and sold without leverage. It reflects: Real buyer demand
Real seller distribution
Organic capital inflow
Genuine market participation
Unlike derivatives markets, spot markets cannot be inflated through leverage or synthetic exposure. This makes spot volume one of the purest indicators of:
“True conviction in the market”
When spot volume declines while price holds steady, it usually indicates participation fatigue or liquidity compression rather than healthy accumulation alone.
CURRENT MARKET STRUCTURE (MAY 2026)
Bitcoin Price: ~$78K – $82.5K
Spot Volume: ↓ 30%–55% below 90-day average
Volatility: Compressed
Futures Open Interest: Stable to slightly elevated
Order Book Depth: Gradually thinning on spot side
Liquidity Behavior: Increasingly passive
This environment defines what professionals often describe as:
“Low Participation Equilibrium Phase”
A state where price remains stable, but underlying market engagement weakens.
WHY SPOT VOLUME IS DECLINING (STRUCTURAL DRIVERS)
1. GLOBAL MACRO LIQUIDITY DEFENSIVE MODE
Global capital conditions remain cautious: Uncertain interest rate direction
Mixed inflation expectations
Geopolitical risk fluctuations
Uneven institutional inflows
Result: capital prefers preservation over deployment.
Spot markets feel this first due to direct capital requirement.
2. POST-RALLY SUPPLY ABSORPTION PHASE
Following previous expansion cycles: Early investors realized profits
Long-term holders slowed accumulation
Market absorbed large supply blocks
This naturally reduces turnover and spot activity.
3. DERIVATIVES-LED MARKET DOMINANCE
A structural shift continues in 2026: Futures markets dominate short-term trading
Leverage replaces spot positioning
Hedging becomes more common than accumulation
Liquidity is increasingly synthetic rather than organic
Result:
Spot exchanges show reduced activity despite active market speculation elsewhere.
4. RETAIL PARTICIPATION COOLDOWN
Retail-driven volume is weakening due to: Sideways price frustration
Lack of breakout confirmation
Fear of false moves
Reduced social momentum
This creates a natural decline in organic demand.
5. INSTITUTIONAL ACCUMULATION SHIFT (OFF-EXCHANGE FLOW)
Institutions continue participating, but differently: Execution via OTC desks
Avoidance of visible exchange order books
Algorithmic staggered accumulation
Long-duration positioning strategies
This results in: Lower visible spot volume despite ongoing accumulation pressure.
MICROSTRUCTURE ANALYSIS (ORDER BOOK DYNAMICS)
ORDER BOOK CONDITIONS
Liquidity thinning below $78K support
Heavy resistance liquidity near $82K–$83K
Reduced passive limit orders on both sides
Increased sensitivity to low-volume moves
MARKET MAKER BEHAVIOR
In low-volume environments, market makers typically: Widen spreads
Reduce liquidity provision
Exploit stop clusters
Amplify small flows into larger moves
This increases the probability of: Sharp wicks
False breakouts
Liquidity sweeps
ON-CHAIN BEHAVIOR SIGNALS (STRUCTURAL SUPPORT)
Typical accompanying on-chain conditions include: Declining exchange inflows
Rising dormant supply
Stable long-term holder conviction
Reduced retail transaction activity
Neutral funding rates
Interpretation: The market is not exiting — it is compressing into inactivity.
PRICE STRUCTURE IMPACT
Low spot volume creates a fragile equilibrium:
1. WEAK PRICE FOUNDATION
Small orders can disproportionately move price.
2. FALSE BREAKOUT ENVIRONMENT
Low liquidity allows temporary directional spikes
.
3. LIQUIDITY SWEEP CONDITIONS
Price tends to: Break below support to trap longs
Break above resistance to trap shorts
4. VOLATILITY COMPRESSION
Energy builds internally like a coiled spring.
WHY THIS PHASE MATTERS MORE THAN IT LOOKS
Historically, low participation phases often act as:
Pre-volatility expansion zones
Re-accumulation structures
Macro decision points
The market is not inactive — it is transitioning.
CATALYSTS FOR SPOT VOLUME RECOVERY
1. MACRO LIQUIDITY EXPANSION
Interest rate easing
Inflation stabilization
Risk-on sentiment return
2. INSTITUTIONAL ETF FLOW ACCELERATION
Sustained inflows
Reduced redemption pressure
Large capital allocations
3. TECHNICAL BREAKOUT CONFIRMATION
Break above $83K with strong volume
Acceptance above resistance level
Momentum participation returns
4. RETAIL RE-ENTRY CYCLE
Social engagement revival
Increased FOMO behavior
Exchange onboarding spikes
5. MARKET INFRASTRUCTURE INCENTIVES
Lower trading fees
Exchange campaigns
Regional adoption growth
TRADING STRATEGY IN LOW VOLUME CONDITIONS
1. AVOID OVER-LEVERAGE
Low liquidity increases: Slippage risk
Stop hunting probability
False move frequency
2. RANGE-BOUND STRUCTURE TRADING
Key levels: Support: $78K
Resistance: $82K–$83K
Focus on reaction-based trading.
3. DIVERGENCE MONITORING
Critical signal: Rising futures open interest + falling spot volume
= potential liquidation-driven expansion move
4. ACCUMULATION APPROACH (LONG-TERM)
Gradual entry strategy
DCA into weakness zones
Avoid emotional positioning
5. RISK MANAGEMENT PRIORITY
Wider stops required
Smaller position sizing
Avoid chasing volatility spikes
SCENARIO OUTLOOK
BULLISH EXPANSION CASE
Spot volume returns
Break above $83K
Momentum acceleration
Target: $88K – $92K
BEARISH LIQUIDITY BREAKDOWN
Continued volume decline
Break below $78K
Move toward $72K – $75K
BASE CASE (MOST LIKELY)
Extended consolidation between $75K–$83K
Low participation continues
Market waits for catalyst
FINAL STRUCTURE CONCLUSION
Bitcoin’s current environment is defined not by fear or euphoria — but by liquidity compression and participation decline.
Key insight: Price stability is masking weakening underlying engagement.
This phase represents: Institutional patience
Retail hesitation
Derivatives dominance
Spot market inactivity
Historically, such conditions do not mark the end of a trend — but rather the buildup phase before volatility expansion.
FINAL THOUGHT
The Bitcoin market in May 2026 is effectively operating in a low participation equilibrium structure.
No major breakdown is confirmed yet — but internal energy is accumulating.
The next major directional move will depend on one key factor: Return of real spot demand and liquidity expansion.
Until then, disciplined positioning and structural awareness remain the dominant edge in the market.