


1. Market Review: From Sharp Drop to Rebound, Strength Doubtful
In early June, Bitcoin experienced a fierce sell-off. On June 5th, BTC first broke below the $60k psychological level in over four years, dropping as low as $59,207; that week, it fell 16%, marking the most severe weekly decline since the FTT collapse in November 2022. Since then, prices have oscillated weakly in the $61,000-$64,000 range.
A turning point occurred on June 14th—when the US and Iran announced a temporary peace agreement, and the Strait of Hormuz would reopen. Boosted by this, Bitcoin quickly rebounded, rising to $66,805 on June 15th, and further climbing above $66,000 on June 16th, reaching the highest level since the sharp decline in early June. As of June 16th, BTC hovered around $66,000, with a high of $67,217 intraday before retreating.
The current rebound was mainly driven by a temporary easing of geopolitical risks, but its strength and sustainability are doubtful. Compared to the Nasdaq 100 futures rising 2.5% and S&P 500 futures up 1.6%, Bitcoin’s rebound appears relatively restrained.
---
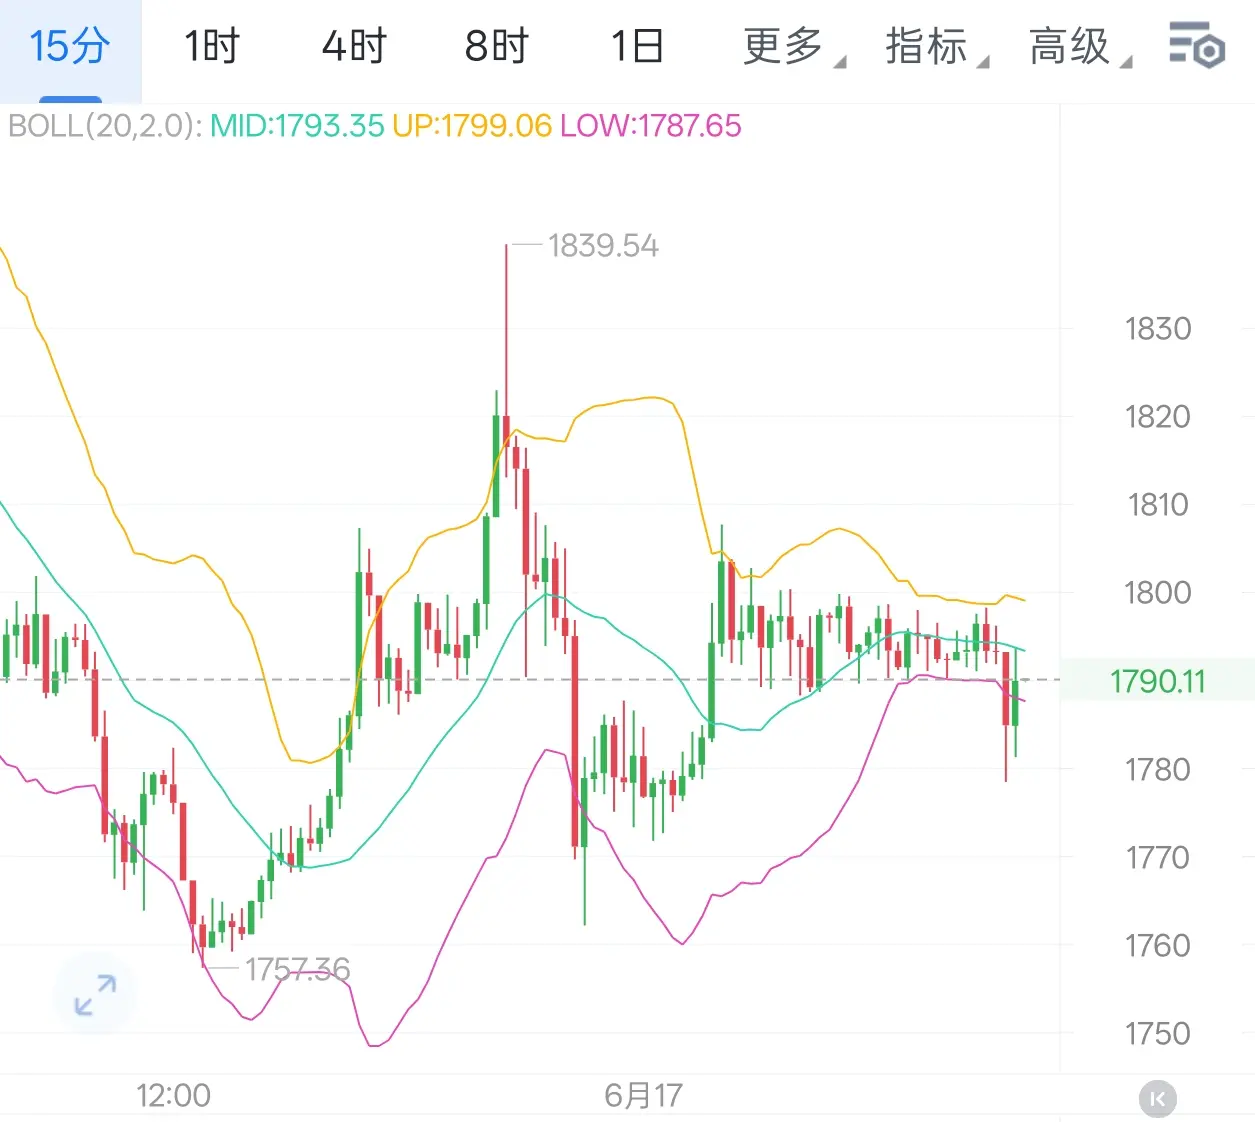
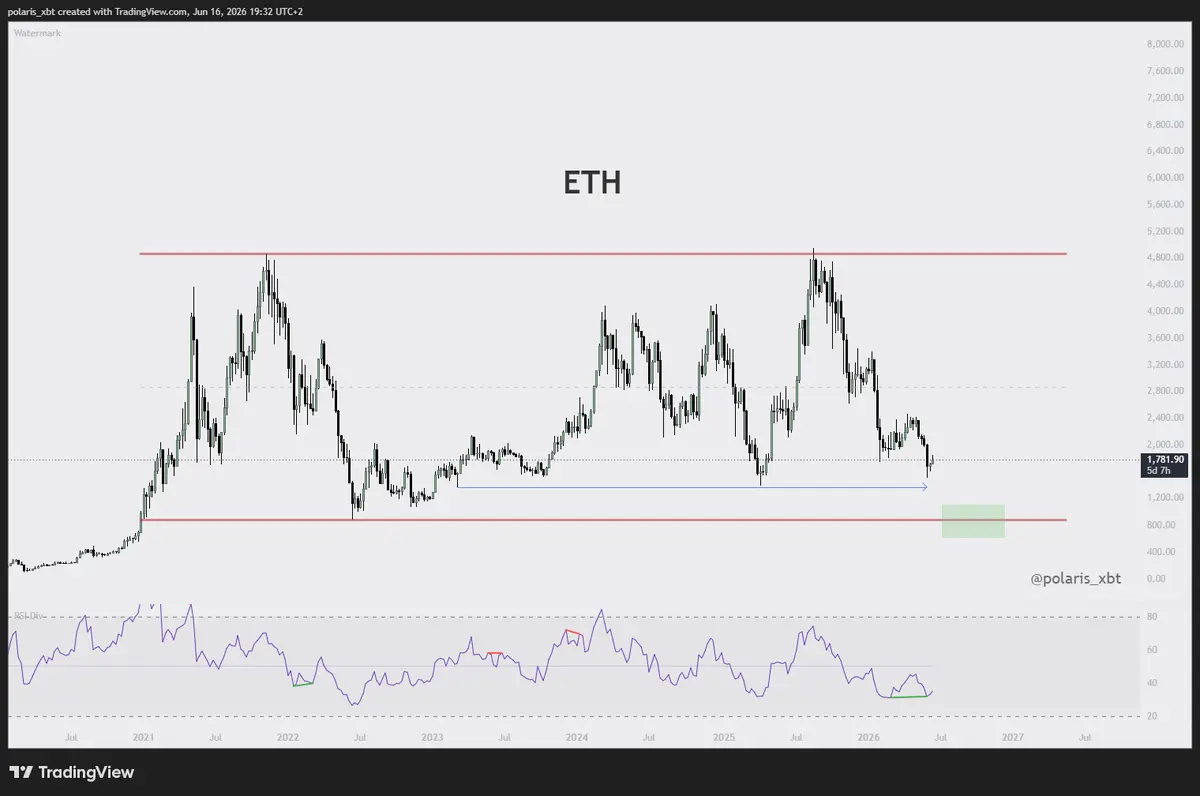
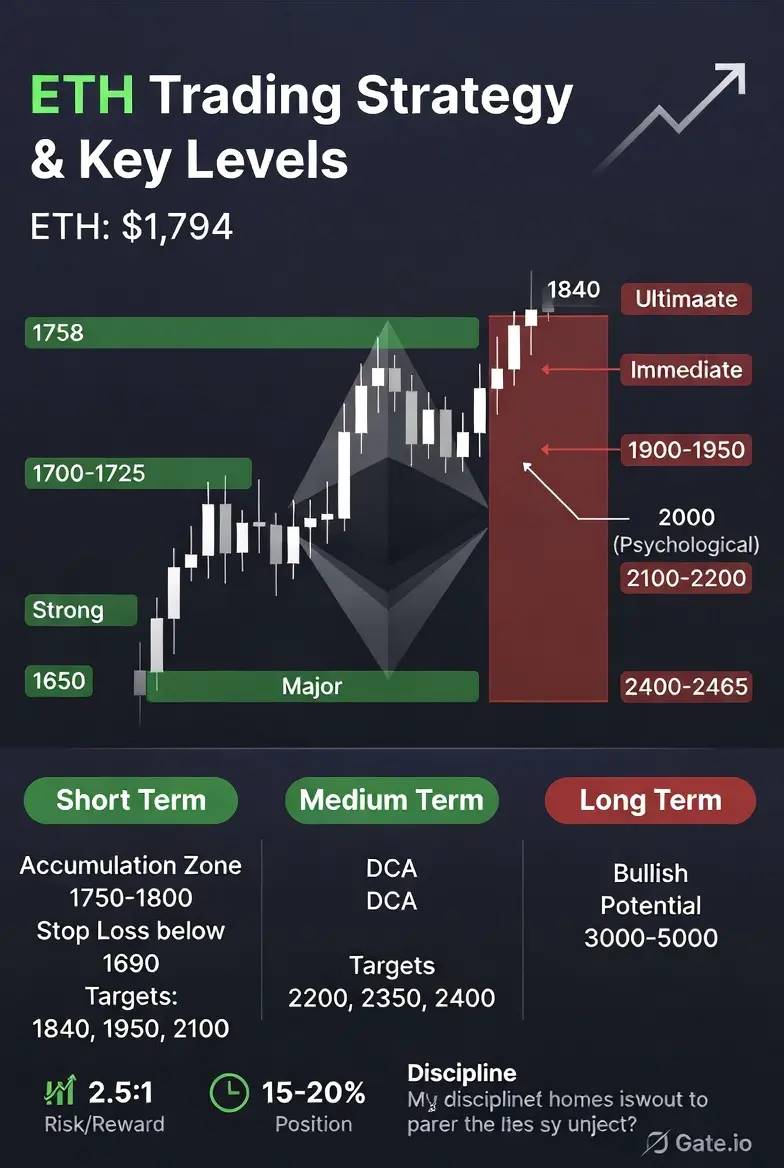
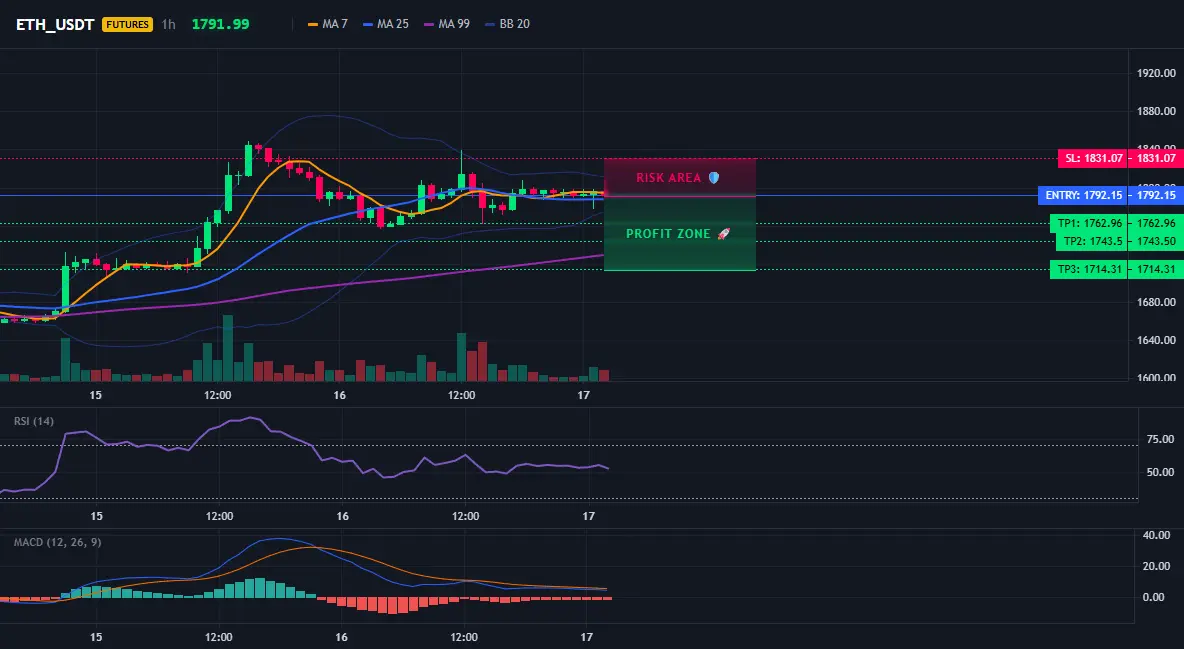
2. Technical Analysis: Major Cycle Under Pressure, Short Cycle Rebound
On the daily chart, Bitcoin remains below the 20-day moving average (about $66,700), with all cycle moving averages in a bearish alignment—20-day EMA ($66,600), 50-day EMA ($70,600), 100-day EMA ($73,200), 200-day EMA ($78,600)—forming a typical bearish structure. The daily RSI is around 42, in a neutral to weak zone, neither oversold enough to trigger a strong rebound nor showing momentum for sustained upward movement. The overall downtrend remains unbroken.
On the shorter cycle, the hourly chart shows a clear upward channel, with prices above short-term moving averages. Key resistance zones are between $66,000 and $68,000—areas that were heavily traded bottoms in February and April. Bulls need to break through and hold above this zone with increased volume to confirm a reversal of the downtrend since May; otherwise, it may just be a corrective rebound.
For short-term support, there is a bullish trendline near $64,200 built from active support structures; the critical bottom support zone is between $60,000 and $59,900. A confirmed break below this level could target liquidity levels around $56,000-$52,000.
---
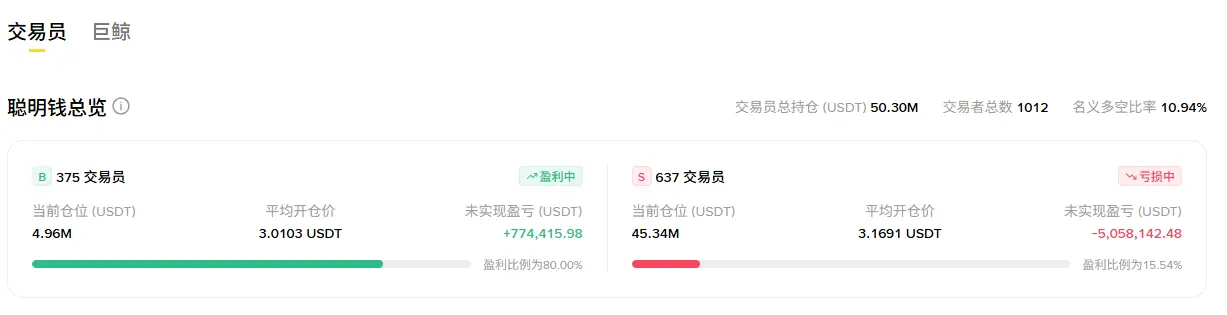
3. Market Liquidity and Sentiment: Institutions Have Not Truly Returned
ETF outflows remain the biggest structural headwind. Since mid-May, US spot Bitcoin ETFs have net outflows exceeding $4.75 billion; in June alone, about $2.1 billion has been withdrawn, with BlackRock experiencing redemptions for five consecutive weeks. Although there was a single-day net inflow of $85.85 million on June 12th, this was more of a tentative dip-buying attempt, and the long-term capital exit trend has not fundamentally reversed.
Stablecoin liquidity continues to shrink. The total reserves of exchange-held stablecoins dropped from a peak of $75.12 billion in November 2025 to $62.81 billion on June 10th, a decline of nearly 16%, indicating that new funds have yet to re-enter the market.
Market sentiment, as measured by the crypto fear and greed index, remains in "extreme fear." In the derivatives market, the total liquidation amount over 24 hours reached $339 million, with over 70% of liquidations being shorts—indicating that this rebound is more driven by short covering pulses rather than fresh capital inflows causing a fundamental reversal.
---
4. Key Macro Variables: Three "Boots" Awaiting Drop
First, the Federal Reserve FOMC meeting (June 17-18). The market prices in a 98.2% probability of holding rates steady, but with US CPI year-over-year rising to 4.2% in May—its highest in three years—expectations for a rate cut have been pushed back to 2027. If the meeting signals a hawkish stance, the rebound could quickly fizzle.
Second, the formal signing of the US-Iran agreement (June 19). Previous ceasefires in April and June 9 failed, with all gains erased. Israeli strikes on Lebanon suggest the Middle East tinderbox remains untripped, and execution risks of the agreement still exist.
Third, Japan’s central bank raising interest rates. On June 16th, the Bank of Japan increased its policy rate by 25 basis points to 1%, the highest since 1995. Yen carry trades are tightening, potentially triggering chain reactions in high-leverage assets.
---
5. Diverging Institutional Views
· Bullish (Standard Chartered): Believes $59,000 has essentially formed a bottom, maintaining a target of $100k by the end of 2026.
· Bearish: Points out that the market has not yet shown typical "capitulation selling," and the true bottom may be in the $40,000-$46,000 range.
· Fidelity emphasizes that the market is currently in a "volatility narrowing" phase.
---
6. Summary
Currently, Bitcoin is in a contradictory pattern of "major cycle under pressure, short cycle rebound." Around $60,000, some analysts see a "behavioral pressure zone," while $48k is viewed as a "structural risk boundary." The short-term rebound is driven by geopolitical news, resembling an event-driven pulse rather than a trend reversal.
Key variables for future movement include: Federal Reserve policy signals, whether ETF capital flows can sustain positive momentum, and the implementation of the US-Iran agreement. Before the $66,700 resistance is effectively broken and ETF inflows are confirmed, blindly chasing the rally carries significant risk, and traders should watch out for a secondary correction after the rebound. #我的Gate交易时刻
In early June, Bitcoin experienced a fierce sell-off. On June 5th, BTC first broke below the $60k psychological level in over four years, dropping as low as $59,207; that week, it fell 16%, marking the most severe weekly decline since the FTT collapse in November 2022. Since then, prices have oscillated weakly in the $61,000-$64,000 range.
A turning point occurred on June 14th—when the US and Iran announced a temporary peace agreement, and the Strait of Hormuz would reopen. Boosted by this, Bitcoin quickly rebounded, rising to $66,805 on June 15th, and further climbing above $66,000 on June 16th, reaching the highest level since the sharp decline in early June. As of June 16th, BTC hovered around $66,000, with a high of $67,217 intraday before retreating.
The current rebound was mainly driven by a temporary easing of geopolitical risks, but its strength and sustainability are doubtful. Compared to the Nasdaq 100 futures rising 2.5% and S&P 500 futures up 1.6%, Bitcoin’s rebound appears relatively restrained.
---
2. Technical Analysis: Major Cycle Under Pressure, Short Cycle Rebound
On the daily chart, Bitcoin remains below the 20-day moving average (about $66,700), with all cycle moving averages in a bearish alignment—20-day EMA ($66,600), 50-day EMA ($70,600), 100-day EMA ($73,200), 200-day EMA ($78,600)—forming a typical bearish structure. The daily RSI is around 42, in a neutral to weak zone, neither oversold enough to trigger a strong rebound nor showing momentum for sustained upward movement. The overall downtrend remains unbroken.
On the shorter cycle, the hourly chart shows a clear upward channel, with prices above short-term moving averages. Key resistance zones are between $66,000 and $68,000—areas that were heavily traded bottoms in February and April. Bulls need to break through and hold above this zone with increased volume to confirm a reversal of the downtrend since May; otherwise, it may just be a corrective rebound.
For short-term support, there is a bullish trendline near $64,200 built from active support structures; the critical bottom support zone is between $60,000 and $59,900. A confirmed break below this level could target liquidity levels around $56,000-$52,000.
---
3. Market Liquidity and Sentiment: Institutions Have Not Truly Returned
ETF outflows remain the biggest structural headwind. Since mid-May, US spot Bitcoin ETFs have net outflows exceeding $4.75 billion; in June alone, about $2.1 billion has been withdrawn, with BlackRock experiencing redemptions for five consecutive weeks. Although there was a single-day net inflow of $85.85 million on June 12th, this was more of a tentative dip-buying attempt, and the long-term capital exit trend has not fundamentally reversed.
Stablecoin liquidity continues to shrink. The total reserves of exchange-held stablecoins dropped from a peak of $75.12 billion in November 2025 to $62.81 billion on June 10th, a decline of nearly 16%, indicating that new funds have yet to re-enter the market.
Market sentiment, as measured by the crypto fear and greed index, remains in "extreme fear." In the derivatives market, the total liquidation amount over 24 hours reached $339 million, with over 70% of liquidations being shorts—indicating that this rebound is more driven by short covering pulses rather than fresh capital inflows causing a fundamental reversal.
---
4. Key Macro Variables: Three "Boots" Awaiting Drop
First, the Federal Reserve FOMC meeting (June 17-18). The market prices in a 98.2% probability of holding rates steady, but with US CPI year-over-year rising to 4.2% in May—its highest in three years—expectations for a rate cut have been pushed back to 2027. If the meeting signals a hawkish stance, the rebound could quickly fizzle.
Second, the formal signing of the US-Iran agreement (June 19). Previous ceasefires in April and June 9 failed, with all gains erased. Israeli strikes on Lebanon suggest the Middle East tinderbox remains untripped, and execution risks of the agreement still exist.
Third, Japan’s central bank raising interest rates. On June 16th, the Bank of Japan increased its policy rate by 25 basis points to 1%, the highest since 1995. Yen carry trades are tightening, potentially triggering chain reactions in high-leverage assets.
---
5. Diverging Institutional Views
· Bullish (Standard Chartered): Believes $59,000 has essentially formed a bottom, maintaining a target of $100k by the end of 2026.
· Bearish: Points out that the market has not yet shown typical "capitulation selling," and the true bottom may be in the $40,000-$46,000 range.
· Fidelity emphasizes that the market is currently in a "volatility narrowing" phase.
---
6. Summary
Currently, Bitcoin is in a contradictory pattern of "major cycle under pressure, short cycle rebound." Around $60,000, some analysts see a "behavioral pressure zone," while $48k is viewed as a "structural risk boundary." The short-term rebound is driven by geopolitical news, resembling an event-driven pulse rather than a trend reversal.
Key variables for future movement include: Federal Reserve policy signals, whether ETF capital flows can sustain positive momentum, and the implementation of the US-Iran agreement. Before the $66,700 resistance is effectively broken and ETF inflows are confirmed, blindly chasing the rally carries significant risk, and traders should watch out for a secondary correction after the rebound. #我的Gate交易时刻