SUI price has spent the last few weeks drifting lower, frustrating anyone watching the chart closely. Each small bounce faded quickly, and sellers kept control of the bigger picture. That slow grind lower has now pushed SUI price into a zone that matters, and the chart is starting to hint that something different could be forming.
Over the last 17 days alone, SUI price has dropped by more than 30%. That kind of move usually leaves a clear emotional footprint on the chart, especially when price approaches levels where buyers previously stepped in with confidence. That moment is getting closer.
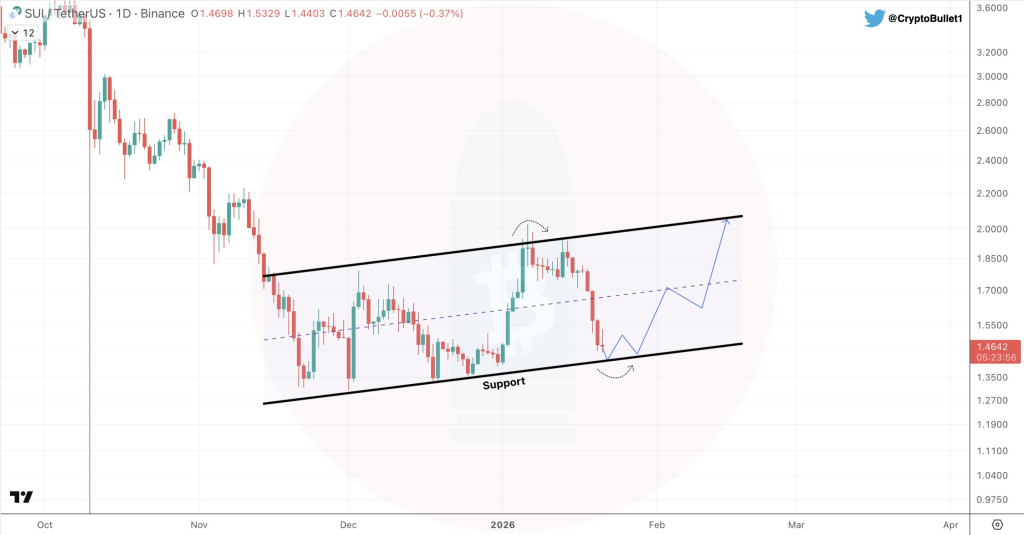
A tweet from a crypto analyst, Sui Insiders, has pointed out that SUI price is now back at daily support. That observation aligns with what the chart shows, as price sits near the lower channel boundary where buyers previously became active.
Current price action shows SUI price sliding back toward a zone where liquidity was absorbed in the past. That same area previously acted as a base before sharp upside moves. Price returning to such levels often forces the market to make a decision, either defending support again or breaking lower with momentum.
@SuiInsiders / X
The chart shows a potential bounce scenario toward $2.05, which aligns with the channel top. That target sits near the upper trendline, where price has been rejected multiple times before.
The attached chart helps visualize this setup clearly. SUI price is compressing near support, while the channel structure remains intact.
Price action shows long lower wicks forming near support, suggesting buyers are reacting even while the broader trend remains weak. That reaction alone does not confirm a reversal, yet it shows that sellers are no longer moving price freely.
SUI Indicators Still Point To Bearish Conditions Despite Support Holding
Technical indicators are still flashing caution across the board. Most momentum and trend indicators remain firmly in sell territory. That situation might look discouraging on the surface, yet indicators tend to lag price, especially during potential transition phases.
Price action remains the most real time signal, and it often shifts before indicators follow. That is why support reactions deserve attention even when indicators stay bearish.
Technical Indicator Snapshot For SUI
| Name |
| Value |
| Action |
| — |
| RSI(14) |
| 38.748 |
| Momentum remains weak, showing sellers still control strength levels |
| STOCH(9,6) |
| 20.492 |
| Oversold conditions persist without a confirmed reversal signal |
| MACD(12,26) |
| -0.023 |
| Trend momentum continues pointing lower with no bullish crossover |
| ADX(14) |
| 49.664 |
| Strong trend strength favors the existing bearish direction |
| ROC |
| -17.129 |
| Rate of change confirms negative momentum remains dominant |
These readings explain why caution still matters here. Indicators are not yet supporting a bullish shift, even though price is reacting at support.
Why Price Action Alone Is Not Enough To Call A Reversal For SUI
Price action offers valuable clues, yet relying on it alone carries risk. Strong reversals usually come with confirmation from multiple signals, including pattern development and improving indicator behavior. Waiting for signs such as higher lows, volume expansion, or indicator stabilization often reduces false signals.
Here’s the TAO Price If Bittensor Becomes the Backbone of Onchain AI_**
Support holds can fail, especially when broader market pressure remains heavy. A clean break below current support could open the door to deeper downside and shift the entire structure lower.
For now, SUI price sits at a crossroads. Support is being tested, indicators remain bearish, and the chart is asking an important question. The next reaction should reveal whether this level becomes a base or simply another pause before continuation.
Disclaimer: The information on this page may come from third parties and does not represent the views or opinions of Gate. The content displayed on this page is for reference only and does not constitute any financial, investment, or legal advice. Gate does not guarantee the accuracy or completeness of the information and shall not be liable for any losses arising from the use of this information. Virtual asset investments carry high risks and are subject to significant price volatility. You may lose all of your invested principal. Please fully understand the relevant risks and make prudent decisions based on your own financial situation and risk tolerance. For details, please refer to
Disclaimer.
Related Articles
Bitcoin Must Break Above $88,880 to Confirm Bottom, CryptoQuant Analysis Warns
According to CryptoQuant, Bitcoin must break above $88,880 to confirm a bottom, as on-chain data shows this level represents the cost basis of investors who held for 3 to 6 months. The cryptocurrency analytics firm noted that while Bitcoin is currently trading around $80,870, realized cost prices of
GateNews10m ago
Cardano Holds $0.25 Support as $0.257 Level Drives Near-Term Momentum
Key Insights:
Cardano maintains strong support near $0.25 as consistent buying pressure prevents breakdown and sustains a base formation during the ongoing market consolidation phase.
A breakout above $0.257 could unlock short-term upside potential, allowing the price to test higher
CryptoNewsLand1h ago
BNB Holds $617 as ETF Momentum and Burns Tighten Supply
Key Insights:
BNB trades near $617 while ETF developments and token burns tighten supply, signaling rising institutional interest and strengthening underlying demand dynamics.
AI agent growth on BNB Chain surges rapidly, driving user activity higher and reinforcing the network’s role in supp
CryptoNewsLand1h ago
Solana Faces Selling Pressure Despite Record Transaction Growth
Solana posted >10B Q1 transactions amid waning activity and whale exits; Visa and Meta integrations expanded the ecosystem, yet price stayed bearish, trading ~83 with expected 80–86 range and consolidation.
Abstract: The article analyzes Solana's Q1 2026 performance, noting throughput surpassed 10 billion transactions despite declining activity and whale withdrawals. It highlights ecosystem expansion through Visa and Meta integrations, which broaden payments use but did not translate into near-term price momentum. Technical indicators remain bearish with a near-term consolidation in the 80–86 range and potential breakout as a key driver of next moves.
CryptoNewsLand1h ago
SUI Holds Near $0.91 as Long Positions Signal Possible Bounce
Key Insights
SUI holds near $0.91 while large traders maintain long positions, creating divergence between price action and sentiment during the ongoing consolidation phase.
Support near $0.88 remains intact as resistance caps upside, with compressed volatility signaling a likely breakout
CryptoNewsLand2h ago
XRP Price Struggles Below Key Resistance as Selling Pressure Builds
Key Insights:
XRP maintains a bearish structure with consistent lower highs, while resistance zones between $1.41 and $1.46 continue to block upward momentum effectively.
Declining open interest and persistent spot outflows highlight reduced trader participation, reflecting cautious
CryptoNewsLand2h ago
